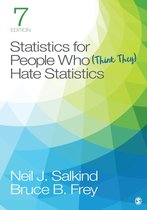
TEST BANK STATISTICS FOR PEOPLE WHO THINK
THEY HATE STATISTICS 7TH EDITION SALKIND FREY
(CHAPTER 1-19) QUESTIONS AND CORRECT
ANSWERS (VERIFIED ANSWERS) Q&A 2026
|INSTANT DOWNLOAD PDF
1. Which of the following best describes descriptive statistics?
A. Methods used to predict future outcomes
B. Techniques for organizing and summarizing data
C. Methods for proving hypotheses
D. Procedures for experimental design
Rationale: Descriptive statistics focus on summarizing and
presenting data in meaningful ways such as graphs, tables, and
averages.
Correct answer: B
2. A population is best defined as:
A. A subset of individuals studied
B. All individuals or items of interest in a study
C. Only survey respondents
D. A randomly selected group
,Rationale: A population includes the entire group being
studied, not just a sample.
Correct answer: B
3. Which measure is most affected by extreme values?
A. Median
B. Mode
C. Mean
D. Range only
Rationale: The mean is sensitive to outliers because it uses all
values in calculation.
Correct answer: C
4. What type of variable is “number of children in a
household”?
A. Continuous
B. Nominal
C. Discrete
D. Ordinal
Rationale: It is a countable whole number, making it discrete.
Correct answer: C
5. A histogram is used to display:
,A. Categorical data
B. Relationships between variables
C. Frequency distribution of continuous data
D. Percentages only
Rationale: Histograms show how continuous data are
distributed across intervals.
Correct answer: C
6. Which level of measurement has a true zero point?
A. Nominal
B. Ordinal
C. Interval
D. Ratio
Rationale: Ratio scales have meaningful zero (e.g., weight,
height).
Correct answer: D
7. The median is:
A. The most frequent score
B. The average of all scores
C. The middle value when data are ordered
D. Always equal to the mean
, Rationale: Median represents the central position in an
ordered dataset.
Correct answer: C
8. A positively skewed distribution means:
A. Most scores are high
B. The tail extends to the left
C. The tail extends to the right
D. Data are perfectly symmetrical
Rationale: Positive skew indicates a long right tail due to high
outliers.
Correct answer: C
9. Inferential statistics are used to:
A. Organize raw data
B. Describe a dataset
C. Make predictions about a population from a sample
D. Draw graphs only
Rationale: Inferential statistics allow generalizations beyond
the sample.
Correct answer: C
10. Variance measures:
THEY HATE STATISTICS 7TH EDITION SALKIND FREY
(CHAPTER 1-19) QUESTIONS AND CORRECT
ANSWERS (VERIFIED ANSWERS) Q&A 2026
|INSTANT DOWNLOAD PDF
1. Which of the following best describes descriptive statistics?
A. Methods used to predict future outcomes
B. Techniques for organizing and summarizing data
C. Methods for proving hypotheses
D. Procedures for experimental design
Rationale: Descriptive statistics focus on summarizing and
presenting data in meaningful ways such as graphs, tables, and
averages.
Correct answer: B
2. A population is best defined as:
A. A subset of individuals studied
B. All individuals or items of interest in a study
C. Only survey respondents
D. A randomly selected group
,Rationale: A population includes the entire group being
studied, not just a sample.
Correct answer: B
3. Which measure is most affected by extreme values?
A. Median
B. Mode
C. Mean
D. Range only
Rationale: The mean is sensitive to outliers because it uses all
values in calculation.
Correct answer: C
4. What type of variable is “number of children in a
household”?
A. Continuous
B. Nominal
C. Discrete
D. Ordinal
Rationale: It is a countable whole number, making it discrete.
Correct answer: C
5. A histogram is used to display:
,A. Categorical data
B. Relationships between variables
C. Frequency distribution of continuous data
D. Percentages only
Rationale: Histograms show how continuous data are
distributed across intervals.
Correct answer: C
6. Which level of measurement has a true zero point?
A. Nominal
B. Ordinal
C. Interval
D. Ratio
Rationale: Ratio scales have meaningful zero (e.g., weight,
height).
Correct answer: D
7. The median is:
A. The most frequent score
B. The average of all scores
C. The middle value when data are ordered
D. Always equal to the mean
, Rationale: Median represents the central position in an
ordered dataset.
Correct answer: C
8. A positively skewed distribution means:
A. Most scores are high
B. The tail extends to the left
C. The tail extends to the right
D. Data are perfectly symmetrical
Rationale: Positive skew indicates a long right tail due to high
outliers.
Correct answer: C
9. Inferential statistics are used to:
A. Organize raw data
B. Describe a dataset
C. Make predictions about a population from a sample
D. Draw graphs only
Rationale: Inferential statistics allow generalizations beyond
the sample.
Correct answer: C
10. Variance measures: