

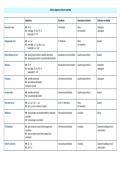
Schema algemene theorie statistiek
Hypothese Distributie Descriptieve statistiek Grafische voorstelling
Gepaarde t-test H0 : δ = 0 T-distributie Mean Scatterplot
H1 : eenzijdig : δ < 0 of δ > 0 Std. deviation Lijndiagram
tweezijdig : δ ≠ 0
Ongepaarde t-test H0 : μ1 = μ2 T- distributie Mean Boxplot
H1 : eenzijdig : μ1 < μ2 of μ1 > μ2 Std. deviation
tweezijdig : μ1 ≠ μ2
Mann-Whitney U-test H0 : beide groepen zitten in dezelfde distributie Standaardnormale distributie Quartiles (percentiles) Boxplot
H1 : beide groepen zitten in verschillende distributie
Wilcoxon H0 : δ = 0 Standaardnormale distributie Quartiles (percentiles) Scatterplot
H1 : eenzijdig : δ < 0 of δ > 0 Lijndiagram
tweezijdig : δ ≠ 0
Friedman H0 : dezelfde distributie Chi-kwadraat distributie Quartiles (percentiles) Lijndiagram
H1 : verschillende distributie
(minstens 1 groep)
Kruskal-wallis H0 : dezelfde distributie Chi-kwadraat distributie Quartiles (percentiles) Boxplot
H1 : verschillende distributie
One-way Anova H0 : μ1 = μ2 = μ3 = … μk Fisher’s F-distributie Mean Boxplot
H1 : μi ≠ μj ( voor minstens 1 koppel) Std. deviation
McNemar H0 : verhoudingen van karakteristieken in populatie Chi-kwadraat distributie Crosstabs 3D bar
zijn gelijk
H1 : verhoudingen verschillend
Chi-kwadraat H0 : geen associatie tussen beide categorische Chi-kwadraat distributie Crosstabs Clustered staafdiagram (via
variabelen chart builder)
H1 : wel associatie tussen beide categorische
variabelen
Fisher’s exact test H0: 𝜋1 = 𝜋2 Chi-kwadraat distributie Crosstabs Clustered staafdiagram (via
H1: 𝜋1 ≠ 𝜋2 chart builder)
Hypothese Distributie Descriptieve statistiek Grafische voorstelling
Gepaarde t-test H0 : δ = 0 T-distributie Mean Scatterplot
H1 : eenzijdig : δ < 0 of δ > 0 Std. deviation Lijndiagram
tweezijdig : δ ≠ 0
Ongepaarde t-test H0 : μ1 = μ2 T- distributie Mean Boxplot
H1 : eenzijdig : μ1 < μ2 of μ1 > μ2 Std. deviation
tweezijdig : μ1 ≠ μ2
Mann-Whitney U-test H0 : beide groepen zitten in dezelfde distributie Standaardnormale distributie Quartiles (percentiles) Boxplot
H1 : beide groepen zitten in verschillende distributie
Wilcoxon H0 : δ = 0 Standaardnormale distributie Quartiles (percentiles) Scatterplot
H1 : eenzijdig : δ < 0 of δ > 0 Lijndiagram
tweezijdig : δ ≠ 0
Friedman H0 : dezelfde distributie Chi-kwadraat distributie Quartiles (percentiles) Lijndiagram
H1 : verschillende distributie
(minstens 1 groep)
Kruskal-wallis H0 : dezelfde distributie Chi-kwadraat distributie Quartiles (percentiles) Boxplot
H1 : verschillende distributie
One-way Anova H0 : μ1 = μ2 = μ3 = … μk Fisher’s F-distributie Mean Boxplot
H1 : μi ≠ μj ( voor minstens 1 koppel) Std. deviation
McNemar H0 : verhoudingen van karakteristieken in populatie Chi-kwadraat distributie Crosstabs 3D bar
zijn gelijk
H1 : verhoudingen verschillend
Chi-kwadraat H0 : geen associatie tussen beide categorische Chi-kwadraat distributie Crosstabs Clustered staafdiagram (via
variabelen chart builder)
H1 : wel associatie tussen beide categorische
variabelen
Fisher’s exact test H0: 𝜋1 = 𝜋2 Chi-kwadraat distributie Crosstabs Clustered staafdiagram (via
H1: 𝜋1 ≠ 𝜋2 chart builder)


