

ECS1601/101/3/2021
8.6.4 Assignment 04 (semester 1)
Assignment 04
Unique number 772527
Closing date 23 April 2021
Learning units 9 to 12 of the Study guide and the relevant
Content chapters of the prescribed book
Questions 45 questions
Weight 30% of the semester mark
To submit Through myUnisa or on a mark-reading sheet
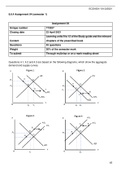
Questions 4.1, 4.2 and 4.3 are based on the following diagrams, which show the aggregate
demand and supply curves.
45
, 4.1 Which one of the diagrams above illustrates the effects of expansionary fiscal and monetary
policies?
[1] figure 1
[2] figure 2
[3] figure 3
[4] figure 4
4.2 Which of the following best demonstrates a movement that would result from the economic
(supply) shock of COVID-19 pandemic?
[1] b to c on figure 4
[2] a to b on figure 3
[3] b to c on figure 2
[4] E1 to E0 on figure 1
4.3 The effects of the decision by the South African Reserve Bank (SARB) to increase the repo
rate and by the National Treasury of South Africa to increase taxes are shown by …
[1] figure 1.
[2] figures 1 and 2.
[3] figure 2.
[4] figures 2 and 3.
[5] figure 4.
4.4 The monetary policy transmission mechanism shows the relationship between __________.
[1] the interest rate and spending by firms
[2] the interest rate and spending by government and households
[3] the total income and investment expenditure
[4] the price level and total production
4.5 The monetary transmission mechanism can be illustrated and explained using three
diagrams showing the link between __________.
[1] interest rate, prices and wages
[2] consumption spending, interest rate and total production
[3] interest rate, investment spending, aggregate spending and total income
[4] investment spending, prices and wages, and aggregate demand
46
8.6.4 Assignment 04 (semester 1)
Assignment 04
Unique number 772527
Closing date 23 April 2021
Learning units 9 to 12 of the Study guide and the relevant
Content chapters of the prescribed book
Questions 45 questions
Weight 30% of the semester mark
To submit Through myUnisa or on a mark-reading sheet
Questions 4.1, 4.2 and 4.3 are based on the following diagrams, which show the aggregate
demand and supply curves.
45
, 4.1 Which one of the diagrams above illustrates the effects of expansionary fiscal and monetary
policies?
[1] figure 1
[2] figure 2
[3] figure 3
[4] figure 4
4.2 Which of the following best demonstrates a movement that would result from the economic
(supply) shock of COVID-19 pandemic?
[1] b to c on figure 4
[2] a to b on figure 3
[3] b to c on figure 2
[4] E1 to E0 on figure 1
4.3 The effects of the decision by the South African Reserve Bank (SARB) to increase the repo
rate and by the National Treasury of South Africa to increase taxes are shown by …
[1] figure 1.
[2] figures 1 and 2.
[3] figure 2.
[4] figures 2 and 3.
[5] figure 4.
4.4 The monetary policy transmission mechanism shows the relationship between __________.
[1] the interest rate and spending by firms
[2] the interest rate and spending by government and households
[3] the total income and investment expenditure
[4] the price level and total production
4.5 The monetary transmission mechanism can be illustrated and explained using three
diagrams showing the link between __________.
[1] interest rate, prices and wages
[2] consumption spending, interest rate and total production
[3] interest rate, investment spending, aggregate spending and total income
[4] investment spending, prices and wages, and aggregate demand
46


