

Preview 2 out of 5 pages
Exam (elaborations)
STAT 200 Week 3 Homework Problems
Preview 2 out of 5 pages
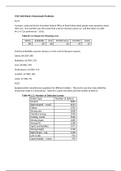
STAT 200 Week 3 Homework Problems 4.1.4 A project conducted by the Australian Federal Office of Road Safety asked people many questions about their cars. One question was the reason that a person chooses a given car, and that data is in table #4.1.4 ("Car preferences," 2013). Table #4.1.4: Reason for Choosing a Car Safety Reliability Cost Performance Comfort Looks 84 62 46 34 47 27 Find the probability a person chooses a car for each of the given reasons. Safety: 84/300= 28% Reliability: 62/300= 21% Cost: 46/300= 15% Performance: 34/300= 11%
Document information
- Uploaded on
- March 7, 2021
- Number of pages
- 5
- Written in
- 2020/2021
- Type
- Exam (elaborations)
- Contains
- Questions & answers
$12.99
Wrong document? Swap it for free
Within 14 days of purchase and before downloading, you can choose a different document. You can simply spend the amount again.
Written by students who passed
Immediately available after payment
Read online or as PDF

Reputation scores are based on the amount of documents a seller has sold for a fee and the reviews they have received for those documents. There are three levels: Bronze, Silver and Gold. The better the reputation, the more your can rely on the quality of the sellers work.
Available in package deal
Package deal
STAT 200 WEEKLY QUIZZES & HOMEWORK PROBLEMS plus MIDTERM & FINAL EXAM BUNDLE OFFER!!!

