Module 2: Auto-Regressive and Moving Average Model
- Case Studies
2.4: Data Examples
2.4.1 IBM Stock Price: ARMA Modeling
In this lesson, I will illustrate ARIMA modeling and forecasting with a data example.
IBM Stock Price Prediction
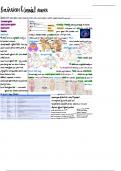
The data example is analyzing the stock price for a large company which has been around for many years. Specifically, we'll focus
on IBM, standing for International Business Machines. The company was initiated in 1911 as the Computing-Tabulating-Recording
Company, which was a merger of four companies. Later in 1933 it became IBM. Since the company has been around for more than
100 years, it has contributed to many innovations and has experienced many disruptive events as provided on the slide. For
example, in 1993, it experienced the highest loss in its history to date, a loss of $8 billion and in 2005, it sold its personal computing
business, since it was not sustainable.
IBM Stock Price
,What is a stock price? In financial terms, it is viewed as the perceived company's worth since multiplied by number of shares gives
the total company's worth. It is generally affected by the number of things including volatility in the market, current economic
conditions, popularity of the company, and events as the ones I mentioned in the previous slide.
The analysis in this study is to develop a model to predict IBM's stock price given that no major events are to be released. The
model presented in this lesson is general and applies to the stock price of other companies, although its performance will be
different.
The data consists of daily stock price from January 29th 1962 until August 26th 2020. The daily stock price is available as open price,
close price, and adjusted close high and low price.
We'll consider here adjusted close, which is the common price analyzed when daily stock price predictions are sought.
Time Series Plots
The input is the file IBMstockprice.txt, accompanying this example. I used the as.date() command in R to convert the date, providing
the data into a date object in R. For this command, the input is the vector of dates converted into character with the specification on
how the dates are recorded. Furthermore, I defined one of the events called Truven to be the date of acquisition of the Truven
company in 2016. The other events are defined similarly.
, I used the ggplot command with inputs, the date and the adjusted closed price, to plot the time series along with the vertical lines
indicating the event acquisition of Truven in 2016, and also other events as provided in the plot. The vertical lines for all other events
are added similarly as for Truven. I did not provide the entire R-code here. You can find the complete R code accompanying this
lesson. Last, I also considered a transformation of the price, specifically, the log transformation.
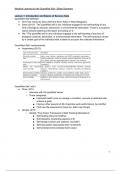
The GG plot of the adjusted close price is on the top left; the time series plot also includes the vertical lines indicating when all the
events mentioned in the previous slide happened. There are several characteristics to point out. The trend is overall monotone,
increasing with fluctuations in the later decades. There is no clear seasonality that can be evaluated visually. However, we can note
the heteroscedasticity or non-constant variance of the time series.
The variability in the stock price clearly shows a big change from being significantly smaller in the early years versus much larger in
later years. We also note that the events did not clearly trigger significant changes at least as seen on this scale. For earlier events it
is hard to distinguish any differences because of the difference in scale. The price is low with low volatility around 1995 with more
distinguishable changes thereafter. In fact, in order to better distinguish patterns throughout the entire time period, it is a good idea
to use a transformation that stabilizes the variance and amplifies local patterns such as the log transformation. Here (in the lower
right plot) I used this transformation on the adjusted close price.
On the log scale, the patterns in the earlier years are much easier to distinguish. For example, we can see the increase in the stock
price after the first family computer was launched in 1964. And we also see a significant drop in the price when the company had a
very large loss in 1993. The merger and acquisition in 2015 and 2016 are followed by an increase in the stock price.
Assessing Dependence & Stationarity
- Case Studies
2.4: Data Examples
2.4.1 IBM Stock Price: ARMA Modeling
In this lesson, I will illustrate ARIMA modeling and forecasting with a data example.
IBM Stock Price Prediction
The data example is analyzing the stock price for a large company which has been around for many years. Specifically, we'll focus
on IBM, standing for International Business Machines. The company was initiated in 1911 as the Computing-Tabulating-Recording
Company, which was a merger of four companies. Later in 1933 it became IBM. Since the company has been around for more than
100 years, it has contributed to many innovations and has experienced many disruptive events as provided on the slide. For
example, in 1993, it experienced the highest loss in its history to date, a loss of $8 billion and in 2005, it sold its personal computing
business, since it was not sustainable.
IBM Stock Price
,What is a stock price? In financial terms, it is viewed as the perceived company's worth since multiplied by number of shares gives
the total company's worth. It is generally affected by the number of things including volatility in the market, current economic
conditions, popularity of the company, and events as the ones I mentioned in the previous slide.
The analysis in this study is to develop a model to predict IBM's stock price given that no major events are to be released. The
model presented in this lesson is general and applies to the stock price of other companies, although its performance will be
different.
The data consists of daily stock price from January 29th 1962 until August 26th 2020. The daily stock price is available as open price,
close price, and adjusted close high and low price.
We'll consider here adjusted close, which is the common price analyzed when daily stock price predictions are sought.
Time Series Plots
The input is the file IBMstockprice.txt, accompanying this example. I used the as.date() command in R to convert the date, providing
the data into a date object in R. For this command, the input is the vector of dates converted into character with the specification on
how the dates are recorded. Furthermore, I defined one of the events called Truven to be the date of acquisition of the Truven
company in 2016. The other events are defined similarly.
, I used the ggplot command with inputs, the date and the adjusted closed price, to plot the time series along with the vertical lines
indicating the event acquisition of Truven in 2016, and also other events as provided in the plot. The vertical lines for all other events
are added similarly as for Truven. I did not provide the entire R-code here. You can find the complete R code accompanying this
lesson. Last, I also considered a transformation of the price, specifically, the log transformation.
The GG plot of the adjusted close price is on the top left; the time series plot also includes the vertical lines indicating when all the
events mentioned in the previous slide happened. There are several characteristics to point out. The trend is overall monotone,
increasing with fluctuations in the later decades. There is no clear seasonality that can be evaluated visually. However, we can note
the heteroscedasticity or non-constant variance of the time series.
The variability in the stock price clearly shows a big change from being significantly smaller in the early years versus much larger in
later years. We also note that the events did not clearly trigger significant changes at least as seen on this scale. For earlier events it
is hard to distinguish any differences because of the difference in scale. The price is low with low volatility around 1995 with more
distinguishable changes thereafter. In fact, in order to better distinguish patterns throughout the entire time period, it is a good idea
to use a transformation that stabilizes the variance and amplifies local patterns such as the log transformation. Here (in the lower
right plot) I used this transformation on the adjusted close price.
On the log scale, the patterns in the earlier years are much easier to distinguish. For example, we can see the increase in the stock
price after the first family computer was launched in 1964. And we also see a significant drop in the price when the company had a
very large loss in 1993. The merger and acquisition in 2015 and 2016 are followed by an increase in the stock price.
Assessing Dependence & Stationarity