29/11/2022 Intelligent Systems Probability
A probability is independent of the observer, frequentism de nes probability ad a property of
repeated experiments.
Relative frequency = number of successes / total trials.
A probability may depend on the observer, probability is an expression of our uncertainty and of
our beliefs (subjective probability).
Subjectivism <—> objectivism, these two views lead to fundamentally di erent ways of doing
statistics; in Ai we use whatever works best; we mix and match the techniques as we like.
Formalizing probability: ‘There is a 60% probability that something will happen’
p(‘something will happen’) = 0,6
When talking about probability we use values between 0 and 1. 0 certain it will not happen, 1
certain it will.
Sample space consists of the sort of atomic things that have probability, not everything that has
probability, but the single things that can happen. When rolling dices the sample space is Ω =
{1,2,3,4,5,6}. When we roll two dice it looks like Ω = {(1,1),(1,2)…(6,6)}. These are discrete sample
spaces. Continuous sample spaces look like this Ω = R.
Events are the things that have probability: aka subsets of the sample space, because the sample
space is represented as a set, each possibility in this set is its own subspace. So if you want to
know the amount of possibilities, you have to take the power set of the sample space.
A probability function within sample spaces can look like this. If we have Ω = {1,2,3,4,5,6} we
could have the probability function p(D=4) this means the probability of the event dice = 4
happens. This is how we use random variables. When using the random variable we often use the
equals sign.
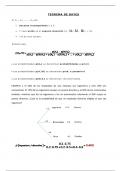
Bernoulli distribution: always for two variables
Categorical distribution: more than two variables.
fi ff
A probability is independent of the observer, frequentism de nes probability ad a property of
repeated experiments.
Relative frequency = number of successes / total trials.
A probability may depend on the observer, probability is an expression of our uncertainty and of
our beliefs (subjective probability).
Subjectivism <—> objectivism, these two views lead to fundamentally di erent ways of doing
statistics; in Ai we use whatever works best; we mix and match the techniques as we like.
Formalizing probability: ‘There is a 60% probability that something will happen’
p(‘something will happen’) = 0,6
When talking about probability we use values between 0 and 1. 0 certain it will not happen, 1
certain it will.
Sample space consists of the sort of atomic things that have probability, not everything that has
probability, but the single things that can happen. When rolling dices the sample space is Ω =
{1,2,3,4,5,6}. When we roll two dice it looks like Ω = {(1,1),(1,2)…(6,6)}. These are discrete sample
spaces. Continuous sample spaces look like this Ω = R.
Events are the things that have probability: aka subsets of the sample space, because the sample
space is represented as a set, each possibility in this set is its own subspace. So if you want to
know the amount of possibilities, you have to take the power set of the sample space.
A probability function within sample spaces can look like this. If we have Ω = {1,2,3,4,5,6} we
could have the probability function p(D=4) this means the probability of the event dice = 4
happens. This is how we use random variables. When using the random variable we often use the
equals sign.
Bernoulli distribution: always for two variables
Categorical distribution: more than two variables.
fi ff