PSYC 3002 WEEK 4 TEST – QUESTION AND ANSWERS
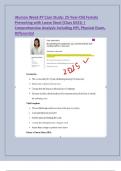
PSYC 3002 WEEK 4 TEST – QUESTION AND ANSWERS • Question 1 2.5 out of 2.5 points When using a p value to determine statistical significance for a one-sample t-test Selected Answer: c. The p value must be less than alpha of .05 to say results are significant. Correct Answer: c. The p value must be less than alpha of .05 to say results are significant. • Question 2 2.5 out of 2.5 points When plotting correlational data, the appropriate graph to use is the Selected Answer: d. scatterplot Correct Answer: d. scatterplot • Question 3 2.5 out of 2.5 points The t distribution that you use to find your critical values closely resembles the normal distribution when the: Selected Answer: c. sample size is large Correct Answer: c. sample size is large • Question 4 2.5 out of 2.5 points A marriage therapist conducts a study and finds a positive linear relationship between the happiness levels of wives and the happiness levels of husbands. This tells the therapist that Selected Answer: c. Happy wives tend to have happy husbands Correct Answer: c. Happy wives tend to have happy husbands • Question 5 2.5 out of 2.5 points If a researcher uses a one-tailed test to test the significance of a correlation, he could be hypothesizing Selected Answer: d. Either a or b Correct Answer: d. Either a or b • Question 6 2.5 out of 2.5 points The first 10 students who arrived for the Friday lecture filled out a questionnaire on their attitudes toward the instructor. The first 10 who were late for the lecture were spotted and afterward filled out the same questionnaire. The appropriate design for testing the significance of the difference between the means is Selected Answer: b. independent-samples t-test Correct Answer: b. independent-samples t-test • Question 7 0 out of 2.5 points Researchers want to see if people taking a new medication for Type II diabetes have lower blood sugar than the population of people with Type II diabetes. The researchers should use a Selected Answer: Correct Answer: a. one-tailed, one-sample t-test • Question 8 0 out of 2.5 points What does a correlation coefficient do? Selected Answer: Correct Answer: c. It simplifies a complex pattern involving many scores into one easily interpreted • Question 9 2.5 out of 2.5 points Suppose you tested two age groups on the number of details they could recall from a paragraph. The mean for the older group is 16, and the mean for the younger group is 14. Furthermore, suppose you fail to reject the null hypothesis for this test. What best accounts for the difference between these sample means? Selected Answer: a. Sampling error Correct Answer: a. Sampling error • Question 10 2.5 out of 2.5 points One-tailed tests are used when we predict the ___________ of the relationship. Selected Answer: a. direction Correct Answer: a. direction • Question 11 2.5 out of 2.5 points Suppose you are using regression to predict how a person’s blood alcohol level is impacted by the number of drinks they consume. The predictor is the ___________ and the criterion is the ____________. Selected Answer: b. number of drinks, blood alcohol level Correct Answer: b. number of drinks, blood alcohol level • Question 12 2.5 out of 2.5 points Suppose you find a -.65 correlation coefficient among sleepiness and happiness, and you compute the proportion of variance accounted for. This tells you that __________ of the variance in happiness is accounted for by sleepiness Selected Answer: b. 42% Correct Answer: b. 42% • Question 13 2.5 out of 2.5 points Suppose a poll has been conducted on Americans' favorable attitudes towards a certain If it is reported that Americans are 56% plus or minus 4% in favor of the issue, which of the following is not a possible value represented within the margin of error? Selected Answer: a. 51% Correct Answer: a. 51% • Question 14 2.5 out of 2.5 points A one-sample t-test compares a __________ to a(n) _______________. Selected Answer: a. sample; population Correct Answer: a. sample; population • Question 15 2.5 out of 2.5 points If a researcher reports a one-sample t-test with df = 24, how many individuals participated in this study? Selected Answer: c. 25 Correct Answer: c. 25 • Question 16 0 out of 2.5 points If we obtain statistically significant results in our analysis, to determine the extent to which the conditions of the independent variable determine dependent scores, we should compute ______________ next. Selected Answer: Correct Answer: a. the effect size • Question 17 2.5 out of 2.5 points Which correlation coefficient presents the stronger relationship among two variables, r = +0.62 or r = –0.62? Selected Answer: c. There is no difference. Correct Answer: c. There is no difference. • Question 18 2.5 out of 2.5 points A U-shaped pattern is an example of a Selected Answer: a. curvilinear relationship Correct Answer: a. curvilinear relationship • Question 19 0 out of 2.5 points Suppose the average reading speed of 15 randomly selected elementary school students is 25, and the average reading speed of 15 randomly selected middle school students is 31. You compute an independent-samples t-test, and your obtained t value is 5.72, which is statistically significant. What is the most appropriate conclusion? Selected Answer: Correct Answer: a. Older students tend to read faster. • Question 20 2.5 out of 2.5 points What are the consequences of having a restricted range? Selected Answer: a. Obtaining a smaller correlation than otherwise would be the case Correct Answer: a. Obtaining a smaller correlation than otherwise would be the case
Written for
- Institution
- PSYC 3002
- Module
- PSYC 3002
Document information
- Uploaded on
- June 28, 2022
- Number of pages
- 7
- Written in
- 2021/2022
- Type
- Exam (elaborations)
- Contains
- Questions & answers
Subjects
-
psyc 3002 week 4 test – question and answers
-
psyc 3002 week 4 test – question and answers • question 1 25 out of 25 points when using a p value to determine statistical significance for a one