

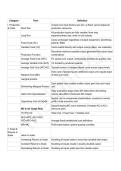
Category Term Definition
I. Production At least one input (factory size etc.) is fixed; cannot adjust all
& Costs Short Run production resources
All production inputs are fully variable; firms may
Long Run expand/contract size, enter or exit industry
Costs unchanged regardless of output (equipment, advertising,
Fixed Costs (FC) patents, R&D)
Variable Costs (VC) Costs rise/fall directly with output volume (labor, raw materials)
Describes maximum possible output generated from given input
g
Production Function combinations
Average Fixed Cost (AFC) FC spread over output; continuously declines as quantity rises
Average Variable Cost (AVC) VC divided by produced quantity
fro Average Total Cost (ATC/AC) Typically forms a U-shaped (bowl) curve across output levels
Marginal Cost (MC)
marignal prodcut
Extra cost of producing one additional output unit; equals slope
of total cost curve
Each added input creates smaller output gain than prior input
Diminishing Marginal Product unit
ol
Early production stage where MC falls before diminishing
Gains from Specialization returns take effect (checkmark MC shape)
Implicit cost to compensate shareholders; counted as normal
Opportunity Cost of Capital profit in total economic cost
el
Upward-sloping MC curve intersects U-shaped AC at AC’s
MC & AC Graph Rule minimum point
TC=FC+VC Total Cost = Fixed Cost + Variable Cost
th
AFC=QFC, AVC=QVC,
ATC=AFC+AVC Average fixed/variable/total cost definitions
MR=MC Profit maximization optimal quantity condition
II. Scale &
Returns to
Scale return to scale
Increasing Returns to Scale Doubling all inputs leads to more than doubled total output
Constant Returns to Scale Doubling all inputs results in exactly doubled output
Decreasing Returns to Scale Doubling all inputs yields less than double output
, Average cost falls as production expands (fixed cost spreading,
Economies of Scale tech advantages)
Average cost rises at high output (managerial overload, facility
Diseconomies of Scale limits)
Minimum Efficient Scale Lowest output where all economies of scale are exhausted
(MES) (bottom of U-shaped AC)
III. Revenue,
Profit & Demand-side scale benefit: product value increases as user
Pricing Network Economies of Scale quantity grows (social media example)
Total Revenue (TR) Total money earned from full product sales
g
Revenue change from selling one extra unit; below price for
Marginal Revenue (MR) price-setting firms
Economic Profit TR minus all explicit + implicit opportunity costs
fro economc cost
Normal Profit
Profit Margin
Markup Ratio
Zero economic profit; firm covers every opportunity cost of
resources
Raw dollar gap between selling price and marginal cost
Profit margin expressed as a share of product price
All (P,Q) combinations generating identical profit; steeper at high
ol
Isoprofit Curve P, flatter near MC
Profit maximization occurs where demand is tangent to highest
Tangency Condition possible isoprofit curve
IV. Demand
el
& Elasticity
Basics Profit Maximization Rule Optimal production quantity satisfies MR = MC
Willingness to Pay (WTP) Highest price a consumer is ready to pay for one unit of good
Law of Demand Quantity demanded falls when price rises, ceteris paribus
th
Income, preferences, substitute/complement prices,
Demand Shifters expectations shift entire demand curve
Movement Along Demand
Curve Quantity change only caused by the good’s own price shift
Normal Good Demand increases with higher consumer income
Inferior Good Demand drops when consumer income increases
Substitutes Goods used interchangeably for consumption
Complements Goods consumed jointly together
Price Elasticity Measures how responsive quantity demanded is to price
I. Production At least one input (factory size etc.) is fixed; cannot adjust all
& Costs Short Run production resources
All production inputs are fully variable; firms may
Long Run expand/contract size, enter or exit industry
Costs unchanged regardless of output (equipment, advertising,
Fixed Costs (FC) patents, R&D)
Variable Costs (VC) Costs rise/fall directly with output volume (labor, raw materials)
Describes maximum possible output generated from given input
g
Production Function combinations
Average Fixed Cost (AFC) FC spread over output; continuously declines as quantity rises
Average Variable Cost (AVC) VC divided by produced quantity
fro Average Total Cost (ATC/AC) Typically forms a U-shaped (bowl) curve across output levels
Marginal Cost (MC)
marignal prodcut
Extra cost of producing one additional output unit; equals slope
of total cost curve
Each added input creates smaller output gain than prior input
Diminishing Marginal Product unit
ol
Early production stage where MC falls before diminishing
Gains from Specialization returns take effect (checkmark MC shape)
Implicit cost to compensate shareholders; counted as normal
Opportunity Cost of Capital profit in total economic cost
el
Upward-sloping MC curve intersects U-shaped AC at AC’s
MC & AC Graph Rule minimum point
TC=FC+VC Total Cost = Fixed Cost + Variable Cost
th
AFC=QFC, AVC=QVC,
ATC=AFC+AVC Average fixed/variable/total cost definitions
MR=MC Profit maximization optimal quantity condition
II. Scale &
Returns to
Scale return to scale
Increasing Returns to Scale Doubling all inputs leads to more than doubled total output
Constant Returns to Scale Doubling all inputs results in exactly doubled output
Decreasing Returns to Scale Doubling all inputs yields less than double output
, Average cost falls as production expands (fixed cost spreading,
Economies of Scale tech advantages)
Average cost rises at high output (managerial overload, facility
Diseconomies of Scale limits)
Minimum Efficient Scale Lowest output where all economies of scale are exhausted
(MES) (bottom of U-shaped AC)
III. Revenue,
Profit & Demand-side scale benefit: product value increases as user
Pricing Network Economies of Scale quantity grows (social media example)
Total Revenue (TR) Total money earned from full product sales
g
Revenue change from selling one extra unit; below price for
Marginal Revenue (MR) price-setting firms
Economic Profit TR minus all explicit + implicit opportunity costs
fro economc cost
Normal Profit
Profit Margin
Markup Ratio
Zero economic profit; firm covers every opportunity cost of
resources
Raw dollar gap between selling price and marginal cost
Profit margin expressed as a share of product price
All (P,Q) combinations generating identical profit; steeper at high
ol
Isoprofit Curve P, flatter near MC
Profit maximization occurs where demand is tangent to highest
Tangency Condition possible isoprofit curve
IV. Demand
el
& Elasticity
Basics Profit Maximization Rule Optimal production quantity satisfies MR = MC
Willingness to Pay (WTP) Highest price a consumer is ready to pay for one unit of good
Law of Demand Quantity demanded falls when price rises, ceteris paribus
th
Income, preferences, substitute/complement prices,
Demand Shifters expectations shift entire demand curve
Movement Along Demand
Curve Quantity change only caused by the good’s own price shift
Normal Good Demand increases with higher consumer income
Inferior Good Demand drops when consumer income increases
Substitutes Goods used interchangeably for consumption
Complements Goods consumed jointly together
Price Elasticity Measures how responsive quantity demanded is to price


