Data scien 2020 Study guides, Class notes & Summaries
Looking for the best study guides, study notes and summaries about Data scien 2020? On this page you'll find 12 study documents about Data scien 2020.
All 12 results
Sort by
-
DATA SCIEN 2020MRA Project MIlestone
- Presentation • 29 pages • 2023
- $9.99
- 1x sold
- + learn more
MARKETING & RETAIL ANALYTICS z PROBLEM STATEMENT ▪ An automobile parts manufacturing company has collected data of transactions for 3 years. They do not have any in-house data science team, thus they have hired you as their consultant. Your job is to use your magical data science skills to provide them with suitable insights about their data and their customers. ▪ DATA: Sales_D z DATA DICTIONARY ORDERNUMBER : Order Number CUSTOMERNAM E : customer QUANTITYORDERED : Quantity or...
-
MRA Project Milestone 2/MARKETING & RETAIL ANALYTICS
- Other • 20 pages • 2023
- $9.49
- 1x sold
- + learn more
PROBLEM STATEMENT ▪ An automobile parts manufacturing company has collected data of transactions for 3 years. They do not have any in-house data science team, thus they have hired you as their consultant. Your job is to use your magical data science skills to provide them with suitable insights about their data and their customers. ▪ DATA: Sales_D z DATA DICTIONARY ORDERNUMBER : Order Number CUSTOMERNAM E : customer QUANTITYORDERED : Quantity ordered PHONE : Phone of the custome...
-
SANDYA VB- TIME SERIES FORECASTING PROJECT
- Exam (elaborations) • 196 pages • 2022
- $11.99
- 5x sold
- + learn more
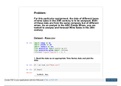
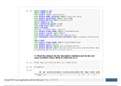
For this particular assignment, the data of different types of wine sales in the 20th century is to be analysed. Both of these data are from the same company but of different wines. As an analyst in the ABC Estate Wines, you are tasked to analyse and forecast Wine Sales in the 20th century. Dataset - R In [1]: import numpy as np import pandas as pd import seaborn as sns from matplotlib import pyplot as plt from import rcParams rcParams['ze'] = 13, 6 1. Read the data as an appropr...

-
DATA SCIEN 2020MRA Project Milestone 2
- Presentation • 20 pages • 2023
- $9.49
- + learn more
MARKETING & RETAIL ANALYTICS MILESTONE - 2 SANDYA VB 29-08-2021 z PROBLEM STATEMENT ▪ A Grocery Store shared the transactional data with you. Your job is to identify the most popular combos that can be suggested to the Grocery Store chain after a thorough analysis of the most commonly occurring sets of items in the customer orders. The Store doesn’t have any combo offers. Can you suggest the best combos & offers? ▪ DATA: dataset_ z TOOLS USED ▪ TABLEAU Tool: Used for Ex...

-
SANDYA VB-Business Report TSF project latest 2023
- Other • 24 pages • 2023
- $9.49
- + learn more
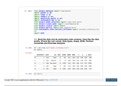
1. Read the data as an appropriate Time Series data and plot the data. The two datasets: Rose and Sparkling are imported using the read command. And convert to time series data using date_range function: date = _range(start='01/01/1980', end='08/01/1995', freq='M')date df['Time_Stamp'] = pd.DataFrame(date,columns=['Month']) () o/p: ROSE WINE YEAR WISE SALES • From the above plot we observe that there is a decreasing trend in the initial years and stabilizes over the years...

And that's how you make extra money

-
MARKETING & RETAIL ANALYTICS MILESTONE - 2
- Exam (elaborations) • 20 pages • 2023
- $9.99
- + learn more
MARKETING & RETAIL ANALYTICS MILESTONE - 2 SANDYA VB z PROBLEM STATEMENT ▪ A Grocery Store shared the transactional data with you. Your job is to identify the most popular combos that can be suggested to the Grocery Store chain after a thorough analysis of the most commonly occurring sets of items in the customer orders. The Store doesn’t have any combo offers. Can you suggest the best combos & offers? ▪ DATA: dataset_ z TOOLS USED ▪ TABLEAU Tool: Used for Exploratory ...
-
DATA SCIEN 2020Machine Learning Project
- Presentation • 72 pages • 2023
- $9.99
- + learn more
In [1]: import pandas as pd import numpy as np from sklearn import preprocessing from _selection import train_test_split from _bayes import GaussianNB from cs import accuracy_score import seaborn as sns import t as plt from import zscore import warnings rwarnings( "ignore") from r_model import LinearRegression from er import KMeans from cs import mean_squared_error from ers_influence import variance_inflation_fac tor import math from r_model import LogisticRegression from sk...
-
DATA SCIEN 2020Predictive Modeling Project
- Presentation • 82 pages • 2023
- $8.99
- + learn more
In [205]: from ets import load_boston import pandas as pd import numpy as np import seaborn as sns import t as plt import as sm from _selection import train_test_split from r_model import LinearRegression from er import KMeans from cs import mean_squared_error from ers_influence import variance_inflation_fac tor import math 1.1. Read the data and do exploratory data analysis. Describe the data briefly. (Check the null values, Data types, shape, EDA). Perform Univariate and Bivari...

-
DATA SCIEN 2020 TIME SERIES FORECASTING PROJECT
- Presentation • 196 pages • 2023
- $9.49
- + learn more
Problem: For this particular assignment, the data of different types of wine sales in the 20th century is to be analysed. Both of these data are from the same company but of different wines. As an analyst in the ABC Estate Wines, you are tasked to analyse and forecast Wine Sales in the 20th century. Dataset - R In [1]: import numpy as np import pandas as pd import seaborn as sns from matplotlib import pyplot as plt from import rcParams rcParams['ze'] = 13, 6 1. Read the data as ...
-
DATA SCIEN 2020Business Report TSF Questions and Answers(2022/2023)
- Presentation • 24 pages • 2023
- $8.99
- + learn more
BUSINESS ANALYSIS REPORT TIME SERIES FORECASTING JUNE 20, 2021 SANDYA V B CONTENTS 1. Read the data as an appropriate Time Series data and plot the data. 2. Perform appropriate Exploratory Data Analysis to understand the data and also perform decomposition. 3. Split the data into training and test. The test data should start in 1991. 4. Build various exponential smoothing models on the training data and evaluate the model using RMSE on the test data. Other models such as regressi...
