Scatterplot Study guides, Class notes & Summaries
Looking for the best study guides, study notes and summaries about Scatterplot? On this page you'll find 857 study documents about Scatterplot.
Page 2 out of 857 results
Sort by
-
WGU C955 Formulas and Terms (Latest 2023/ 2024 Update) Applied Probability and Statistics | Questions and Verified Answers| 100% Correct
- Exam (elaborations) • 55 pages • 2023
-
Available in package deal
-
- $11.49
- + learn more
WGU C955 Formulas and Terms (Latest 2023/ 2024 Update) Applied Probability and Statistics | Questions and Verified Answers| 100% Correct Q: Simpsons Paradox A counterintuitive situation that occurs when a result that appears in individual groups of data disappears or reverses when the groups are combined. Can only occur when the sizes of the groups are inconsistent Q: Lurking Variables : Answer: • A lurking variable is a variable not included in the study, but affects the varia...
 Popular
-
Summary test 2 Research Methodology and Descriptive Statistics - Premaster Business Administration - University of Twente
- Summary • 22 pages • 2024
-
Available in package deal
-
- $7.70
- 5x sold
- + learn more
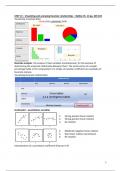
In this summary you can find the micro lectures of this course. It is supplemented with parts from the book of Earl Babbie. This summary is about unit 12-22 & 24.
-
MAT 232: Statistical Literacy Week 5 Assignment 2023
- Exam (elaborations) • 15 pages • 2023
- Available in package deal
-
- $12.49
- 1x sold
- + learn more
MAT 232: Statistical Literacy Week 5 Assignment 2023. For the following pair of variables, state whether you believe the two variables are correlated. If you believe they are correlated, state whether the correlation is positive or negative. Explain your reasoning. The IQ scores and hat sizes of randomly selected adults Choose the correct answer below. A. The variables are not correlated B. Positive correlation because adults with larger hats tend to have higher IQs C. Negative correlation...
-
Straighterline Introduction to Statistics questions with complete solutions 2023
- Exam (elaborations) • 5 pages • 2023
-
Available in package deal
-
- $10.99
- 2x sold
- + learn more
Straighterline Introduction to Statistics questions with complete solutions 2023Four steps in the process of statistics 1. Producing Data 2. Exploratory Data Analysis 3. Probability 4. Inference Categorical variable places individuals into one of several groups Two types: nominal and ordinal Quantitative Variable represents a measurement or a count Two types: Interval and ratio Nominal Variable categorical variables where there is no natural order among the categori...
-
AVV Blok 3 Werken met Excel Bachelor 1
- Summary • 33 pages • 2022
-
- $7.15
- 19x sold
- + learn more
In deze samenvatting worden stap voor stap per week alle colleges samengevat en uitgelegd. Met voorbeelden, aanwijzingen waar je dingen kunt vinden, uitleg van de formules en ook de bijbehorende literatuur zit erbij.
-
WGU C955 - Module 5: Descriptive Statistics for Two Variables | 2024 Questions & Answers | 100% Correct | Verified
- Exam (elaborations) • 23 pages • 2024
-
- $13.49
- + learn more
The relationship between the two variables on a scatterplot can be measured by what statistic? {{ Scatterplot of sales on the x-axis and profit index on the y-axis. }} a Correlation coefficient ( r ) b Regression c ANOVA d Chi-square - Correlation coefficient ( r ) A study was completed to investigate if commutes of longer than 30 minutes increased the risk of burnout. The results of the study are in the table below. ,Lenth of Commute ,<30 Minutes ,>30 Minutes ,Total Risk of Burno...
Histograms and Scatterplots

-
WGU C207 Pre- Assessment Data-Driven Decision-Making Exam (Latest 2023/ 2024 Update) Questions and Verified Answers- 100% Correct
- Exam (elaborations) • 22 pages • 2023
-
Available in package deal
-
- $10.99
- + learn more
WGU C207 Pre- Assessment Data-Driven Decision-Making Exam (Latest 2023/ 2024 Update) Questions and Verified Answers- 100% Correct Q: A hardware store has found that there is a 0.25 probability that a customer buys an electrical product, a 0.45 probability that a customer buys a plumbing product, and a 0.10 probability that a customer buys an electrical product if they purchase a plumbing product Which statistical rule can be used to determine the probability that a customer buys a plumbin...
Histograms and Scatterplots
-
WGU C955 - Module 5: Descriptive Statistics for Two Variables with Complete Solutions
- Exam (elaborations) • 15 pages • 2023
-
Available in package deal
-
- $11.49
- + learn more
WGU C955 - Module 5: Descriptive Statistics for Two Variables with Complete Solutions WGU C955 - Module 5: Descriptive Statistics for Two Variables with Complete Solutions WGU C955 - Module 5: Descriptive Statistics for Two Variables with Complete Solutions The relationship between the two variables on a scatterplot can be measured by what statistic? {{ Scatterplot of sales on the x-axis and profit index on the y-axis. }} a Correlation coefficient ( r ) b Regression c A...

How much did you already spend on Stuvia? Imagine there are plenty more of you out there paying for study notes, but this time YOU are the seller. Ka-ching! Discover all about earning on Stuvia


