UNIT 13 – Visualizing and analyzing bivariate relationships – Babbie Ch. 14 pp. 429-433
Visualizing univariate data:
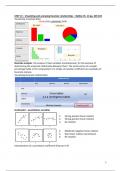
VISUALIZING UNIVARIATE DATA
Bar chart Pie chart
Histogram
Box-plot
Bivariate analysis: the analysis of two variables simultaneously, for the purpose of
determining the empirical relationship between them. The construction of a simple
percentage table or the computation of a simple correlation coefficient are examples of
bivariate analysis.
Visualizing bivariate relationships:
Assignment Unit 13 , Q7: Describe the linear relationship (sign and strength)
Scatterplot – quantitative variables
1.1. Strong positive linear relation
Strong positive linear relation
2. Strong positive linear relation
2. Strong positive linear relation
3. No relation
3. No relation
4.4. Moderate
Moderate negative
negative linear relation
linear
5. relation
Non-linear relation (curvilinear)
6.5. Non-linear
No relation
relation (curvilinear)
6. No relation
Interpretation of a correlation coefficient (Pearson’s R)
1
, Interpretation of a correlation coefficient (Pearson’s r)
Contingency tables display the relationship between two variables (ordinal or nominal
variables)
- A format for presenting the relationships among variables as percentage distributions;
typically used to reveal the effects of the independent variable on the dependent
variable.
𝑐𝑒𝑙𝑙
- Column percentages = ∗ 100%
𝑡𝑜𝑡𝑎𝑙 (𝑐𝑜𝑙𝑢𝑚𝑛)
Neg Pos
Cell = number
NO
Percentage = xx%
Proportions = 0.xx
YES Column total = total
row
Exy = YESPos – YESNeg
UNIT 24 – Describing the association between two variables – Babbie Ch. 16 pp. 458-463
‘Measures of association’ refers to a wide variety of coefficients that measure (the direction
and) the strength of an association between two variables (bi-variate) in a dataset. Most of
the coefficients can take values between -1 (perfect negative association) and +1 (perfect
positive association), with 0 meaning no relationship at all (values close to zero can be seen
as weak associations).
The number of coefficients that can be used to describe relationships between variables is
very large. The choice between these measures depends to a large extent on the level of
measurement of the variables that are being used.
2
, - Pearson’s R: direction and strength of linear correlation with one number. It is a
standardized measure of strength for the linear relationship between two scale
variables only
- Spearman’s rho: can be used as a more robust coefficient to look at the relationship
between two quantitative variables (ordinal or scale). Also, it can be used for
consistently increasing or decreasing non-linear associations. Raw scores are sorted
from high to low and replaced by the ranks of values. The highest value of a variable is
given rank 1, the second highest value is given rank 2, etcetera. Because of that, it can
also be used to look at the bivariate association between two ordinal variables.
- Kendall’s tau: can also be used as a measure of association for a consistently increasing
or decreasing relationship between two ordinal variables, but only when the number of
categories is relatively small so the relationship can be displayed in a contingency table.
Kendall’s tau-b can be used for squared tables (3x3, 4x4, for example), whereas
Kendall’s tau-c can be used for rectangular tables (2x3, 3x4 etc..).
- Cramer’s V: To measure the association between two nominal variables or between a
nominal and an ordinal variable. Unlike the previous coefficients, Cramér’s V cannot
take a value lower than 0, since the categories are not ordered and it therefore does not
make sense to talk about a positive or negative association.
- % difference E: In case of two dichotomous variables. The counts of two dichotomous
variables are shown in a squared contingency table (2x2) and the column percentages
for the independent variable are calculated. The percentages are compared horizontally
and expressed as % difference E.
Scatterplot: is used by quantitative
variables. Person’s R is used to see
the direction and strength of linear
correlation with one number.
See picture ->
3
Visualizing univariate data:
VISUALIZING UNIVARIATE DATA
Bar chart Pie chart
Histogram
Box-plot
Bivariate analysis: the analysis of two variables simultaneously, for the purpose of
determining the empirical relationship between them. The construction of a simple
percentage table or the computation of a simple correlation coefficient are examples of
bivariate analysis.
Visualizing bivariate relationships:
Assignment Unit 13 , Q7: Describe the linear relationship (sign and strength)
Scatterplot – quantitative variables
1.1. Strong positive linear relation
Strong positive linear relation
2. Strong positive linear relation
2. Strong positive linear relation
3. No relation
3. No relation
4.4. Moderate
Moderate negative
negative linear relation
linear
5. relation
Non-linear relation (curvilinear)
6.5. Non-linear
No relation
relation (curvilinear)
6. No relation
Interpretation of a correlation coefficient (Pearson’s R)
1
, Interpretation of a correlation coefficient (Pearson’s r)
Contingency tables display the relationship between two variables (ordinal or nominal
variables)
- A format for presenting the relationships among variables as percentage distributions;
typically used to reveal the effects of the independent variable on the dependent
variable.
𝑐𝑒𝑙𝑙
- Column percentages = ∗ 100%
𝑡𝑜𝑡𝑎𝑙 (𝑐𝑜𝑙𝑢𝑚𝑛)
Neg Pos
Cell = number
NO
Percentage = xx%
Proportions = 0.xx
YES Column total = total
row
Exy = YESPos – YESNeg
UNIT 24 – Describing the association between two variables – Babbie Ch. 16 pp. 458-463
‘Measures of association’ refers to a wide variety of coefficients that measure (the direction
and) the strength of an association between two variables (bi-variate) in a dataset. Most of
the coefficients can take values between -1 (perfect negative association) and +1 (perfect
positive association), with 0 meaning no relationship at all (values close to zero can be seen
as weak associations).
The number of coefficients that can be used to describe relationships between variables is
very large. The choice between these measures depends to a large extent on the level of
measurement of the variables that are being used.
2
, - Pearson’s R: direction and strength of linear correlation with one number. It is a
standardized measure of strength for the linear relationship between two scale
variables only
- Spearman’s rho: can be used as a more robust coefficient to look at the relationship
between two quantitative variables (ordinal or scale). Also, it can be used for
consistently increasing or decreasing non-linear associations. Raw scores are sorted
from high to low and replaced by the ranks of values. The highest value of a variable is
given rank 1, the second highest value is given rank 2, etcetera. Because of that, it can
also be used to look at the bivariate association between two ordinal variables.
- Kendall’s tau: can also be used as a measure of association for a consistently increasing
or decreasing relationship between two ordinal variables, but only when the number of
categories is relatively small so the relationship can be displayed in a contingency table.
Kendall’s tau-b can be used for squared tables (3x3, 4x4, for example), whereas
Kendall’s tau-c can be used for rectangular tables (2x3, 3x4 etc..).
- Cramer’s V: To measure the association between two nominal variables or between a
nominal and an ordinal variable. Unlike the previous coefficients, Cramér’s V cannot
take a value lower than 0, since the categories are not ordered and it therefore does not
make sense to talk about a positive or negative association.
- % difference E: In case of two dichotomous variables. The counts of two dichotomous
variables are shown in a squared contingency table (2x2) and the column percentages
for the independent variable are calculated. The percentages are compared horizontally
and expressed as % difference E.
Scatterplot: is used by quantitative
variables. Person’s R is used to see
the direction and strength of linear
correlation with one number.
See picture ->
3