Rose-Hulman Institute of Technology
Latest uploads at Rose-Hulman Institute of Technology. Looking for notes at Rose-Hulman Institute of Technology? We have lots of notes, study guides and revision notes available for your school.
-
69
- 0
-
1
All courses for Rose-Hulman Institute of Technology
Latest content Rose-Hulman Institute of Technology
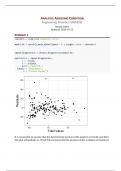
includes Rstudio code that imports data, creates a model of the data, plots the models, makes a conclusion
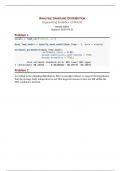
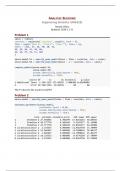
includes Rstudio code that imports data, creates a model of the data, estimates the models parameters with specific confidence interval, calculates error in model, makes a conclusion

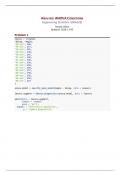
includes Rstudio code that imports data, plots data, models data for two hypotheses, compares models, finds p-value and error, makes a conclusion
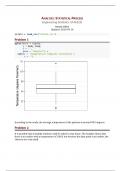
Includes Rstudio code that imports data, creates an ANOVA model of the data, get the diagnostics for the data, plots the model, makes a conclusion
includes Rstudio code that imports data, plots the data, creates anova models for both hypotheses, compares anova models, calculates p-value and error , makes a conclusion
includes Rstudio code that reads data, creates a model, obtains diagnostics, creates a plot and makes a conclusion
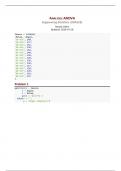
Includes rstudio code to import and analyze data, perform and anova analysis for different models, compare the models, estimate parameters, and make a conclusion
Includes Rstudio code to import data, analyze data, create data plot, and make conclusion based on data.
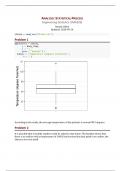
Question 1: Parameter(s) Define the population parameter(s) of interest associated with the research objective. Include both the definition in the context of the problem as well as the symbol you will use to represent this parameter. Our population parameters are the average distance flown by a particular design of airplane. Since we have three designs, the symbols we will use for this are μ_1,μ_2, and μ_3. Question 2: Variables State the response and any other variables (including un...
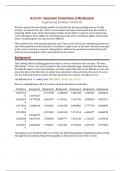
We have spent time developing models to describe the data generating process. In this activity, we look at how the “noise” in our model can help us determine how the model is behaving. While some of the information hidden in the leftover aspects of our model may seem redundant, these skills are extremely important when working in higher dimensions where visualizing the raw data is more difficult.