
MATH 225N (225N)
Chamberlain College Nursing
Hier vind je de beste samenvattingen om te slagen voor MATH 225N (225N). Er zijn o.a. samenvattingen, aantekeningen en oefenvragen beschikbaar.
Populaire samengevatte studieboeken
Tentamen (uitwerkingen)
Math 225 Week 5 Lab Assignment: (Latest, 2021): Chamberlain College Of Nursing |100% Correct Answers, Download To Score A|
Math 225 Week 5 Lab Assignment: (Latest, 2021): Chamberlain College Of Nursing |100% Correct Answers, Download To Score A|
 ELITESOLUTIONS
Tentamen (uitwerkingen)
Math 255N Week 4 Statistics Quiz With Answers
PopulairMATH 225N Week 4 Statistics Quiz – Question and Answers Alice sells boxes of candy at the baseball game and wants to know the mean number of boxes she sells. The numbers for the games so far are 16,14,14,21,15 Given the following list of prices (in thousands of dollars) of randomly selected trucks at a car dealership, find the median…… 20,46,19,14,42,26,33 Each person in a group shuffles a deck of cards and keeps selecting a card until a queen appears. Find the mode of the … followi...
 instructor
Voordeelbundel
(Complete & Answered) MATH 225N Week 7 Bundle: Homework Assignments, Lab Assignment, Discussion
1 Exam (elaborations) MATH 225N Week 7 Assignment Conduct a Hypothesis Test for Proportion – P-Value Approach 2 OTHER MATH 225N Week 7 Assignment Hypothesis Testing Questions and Answers (Test Bank) 2023 3 Exam (elaborations) MATH 225N Week 7 Assignment: Hypothesis Test for the Mean – Population Standard Deviation Known (verified Answers 100% Cor
 NURSEEXAMITY
Voordeelbundel
(Complete & Answered) MATH 225N Week 7 Bundle: Homework Assignments, Lab Assignment, Discussion
1 Exam (elaborations) MATH 225N Week 7 Assignment Conduct a Hypothesis Test for Proportion – P-Value Approach 2 OTHER MATH 225N Week 7 Assignment Hypothesis Testing Questions and Answers (Test Bank) 2023 3 Exam (elaborations) MATH 225N Week 7 Assignment: Hypothesis Test for the Mean – Population Standard Deviation Known (verified Answers 100% Cor
 BESTSELLERSTUVIA01
Tentamen (uitwerkingen)
MATH 225N Week 7 Assignment Conduct a Hypothesis Test for Proportion – P-Value Approach
A teacher claims that the proportion of students expected to pass an exam is greater than 80%. To test this claim, the teacher administers the test to 200 random students and determines that 151 students pass the exam. The following is the setup for this hypothesis test: H0:p=0.80 Ha:p>0.80 In this example, the p-value was determined to be 0.944. Come to a conclusion and interpret the results for this hypothesis test for a proportion (use a significance level of 5%) The decision is ...
BESTSELLERSTUVIA01
Tentamen (uitwerkingen)
MATH 225N Week 7 Assignment Conduct a Hypothesis Test for Proportion – P-Value Approach
A teacher claims that the proportion of students expected to pass an exam is greater than 80%. To test this claim, the teacher administers the test to 200 random students and determines that 151 students pass the exam. The following is the setup for this hypothesis test: H0:p=0.80 Ha:p>0.80 In this example, the p-value was determined to be 0.944. Come to a conclusion and interpret the results for this hypothesis test for a proportion (use a significance level of 5%) The decision is ...
NURSEEXAMITY
Tentamen (uitwerkingen)
MATH 225N Week 7 Assignment: Hypothesis Test for the Mean – Population Standard Deviation Known (verified Answers 100% Correct)
Week 7 Assignment Hypothesis Test for the mean-Pollution Standard Deviation known Compute the value of the test statistic (z-value) for a hypothesis test for one population mean with a known standard deviation Question Jamie, a bowler, claims that her bowling score is less than 168 points, on average. Several of her teammates do not believe her, so she decides to do a hypothesis test, at a 1% significance level, to persuade them. She bowls 17 games. The mean score of the sample games is 155 poin...
BESTSELLERSTUVIA01
Tentamen (uitwerkingen)
MATH 225N Week 7 Assignment: Hypothesis Test for the Mean – Population Standard Deviation Known (verified Answers 100% Correct)
Week 7 Assignment Hypothesis Test for the mean-Pollution Standard Deviation known Compute the value of the test statistic (z-value) for a hypothesis test for one population mean with a known standard deviation Question Jamie, a bowler, claims that her bowling score is less than 168 points, on average. Several of her teammates do not believe her, so she decides to do a hypothesis test, at a 1% significance level, to persuade them. She bowls 17 games. The mean score of the sample games is 155 poin...
NURSEEXAMITY
Tentamen (uitwerkingen)
MATH 225N Week 7 Assignment- Developing Hypothesis and understanding Possible Conclusion for Proportions (2023) complete solutions - Chamberlain.
MATH 225N Week 7 Assignment- Developing Hypothesis and understanding Possible Conclusion for Proportions Identify the null and alternative hypotheses for an experiment with one population proportion Question Devin is a researcher for a pharmaceutical company testing whether a new prescription pain medication causes patients to develop nausea. The medication would have to be scrapped if more than 6% of patients who take the medication develop nausea on a regular basis. Devin randomly selected 461...
NURSEEXAMITY
Tentamen (uitwerkingen)
MATH 225N Week 7 Assignment- Developing Hypothesis and understanding Possible Conclusion for Proportions (2023) complete solutions - Chamberlain.
MATH 225N Week 7 Assignment- Developing Hypothesis and understanding Possible Conclusion for Proportions Identify the null and alternative hypotheses for an experiment with one population proportion Question Devin is a researcher for a pharmaceutical company testing whether a new prescription pain medication causes patients to develop nausea. The medication would have to be scrapped if more than 6% of patients who take the medication develop nausea on a regular basis. Devin randomly selected 461...
BESTSELLERSTUVIA01
Tentamen (uitwerkingen)
MATH 225N Week7 Assignment- Conducting a hypothesis test P-Value Approach, complete solutions (2022/2023).
MATH 225N Week7 Assignment- Conducting a hypothesis test P-Value Approach Determine the p-value for a hypothesis test for the mean (population standard deviation known) Question What is the p-value of a two-tailed one-mean hypothesis test, with a test statistic of z0=−1.73? (Do not round your answer; compute your answer using a value from the table below.) z−1.8−1.7−1.6−1.5−1.4 ....... Make a conclusion and interpret the results of a one-mean hypothesis test (population standard devi...
BESTSELLERSTUVIA01
Tentamen (uitwerkingen)
MATH 225N Week7 Assignment- Conducting a hypothesis test P-Value Approach, complete solutions (2022/2023).
MATH 225N Week7 Assignment- Conducting a hypothesis test P-Value Approach Determine the p-value for a hypothesis test for the mean (population standard deviation known) Question What is the p-value of a two-tailed one-mean hypothesis test, with a test statistic of z0=−1.73? (Do not round your answer; compute your answer using a value from the table below.) z−1.8−1.7−1.6−1.5−1.4 ....... Make a conclusion and interpret the results of a one-mean hypothesis test (population standard devi...
NURSEEXAMITY
Overig
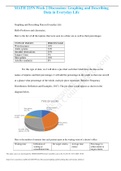
MATH 225N Week 2 Discussion Graphing and Describing Data in Everyday Life (Graded A)
MATH 225N Week 2 Discussion Graphing and Describing Data in Everyday Life (Graded A)
 ScholarVaultHQ
Tentamen (uitwerkingen)
MATH 225 Central Limit Theorem for Proportions Week 5 Assignment : complete solutions (2019/20) Chamberlain.
MATH 225 Central Limit Theorem for Proportions Week 5 Assignment: 1. A dental student is conducting a study on the number of people who visit their dentist regularly. Of the 520 people surveyed, 312 indicated that they had visited their dentist within the past year. Find the population proportion, as well as the mean and standard deviation of the sampling distribution for samples of size n=60. 2. From recent census data, it is discovered that the proportion of the adults in the United States who...
NURSEEXAMITY
Tentamen (uitwerkingen)
Statistic Questions And Answers Revision For Year 2022
Statistic Questions And Answers Revision For Year 2022
 codersimon
Tentamen (uitwerkingen)
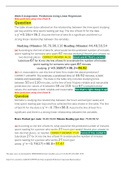
MATH 225N Week 8 Assignment Predictions Using Linear Regression (GRADED)
Question: The table shows data collected on the relationship between the time spent studying per day and the time spent reading per day. The line of best fit for the data is yˆ=0.16x+36.2. Assume the line of best fit is significant and there is a strong linear relationship between the variables….. Studying (Minutes) 50,70,90,110 Reading (Minutes) 44,48,50,54…. According to the line of best fit, what would be the predicted number of minutes spent reading for someone who spent 67minutes study...
 ScholarVaultPRO
Tentamen (uitwerkingen)
MATH 225N Week 8 Assignment Coefficient of Determination (Download To Score An A)
Question: A medical experiment on tumor growth gives the following data table……… The least squares regression line was … Using technology, it was … that the total sum of squares (SST) was 8a nd the sum of squares of regression (SSR) was 3789.0. Calculate R2, rounded to three decimal places. Question: A scientific study on mesothelioma caused by asbestos gives the following data table……. Using technology, it was … that the total sum of squares (SST)was 2 and the sum of squares due...
ScholarVaultPRO
Tentamen (uitwerkingen)
MATH 225N Week 8 Stats Assignment-Performing Linear Regressions with Technology -Exel . (GRADED)
Week 8 Stats Assignment- Performing Linear Regressions with Technology –Exel Determine the best fit linear regression equation using Technology - Excel Question The table below shows data on an nual expenditure, x (in dollars), on recreation and annual income, y (in dollars), of 20 families. Use Excel to find the best fit linear regression equation. Round the slope and intercept to the nearest integer. y=11.0 X+ 14949 Yes that's right. Keep it up! Calculate the correlation coefficient using T...
ScholarVaultPRO
Tentamen (uitwerkingen)
MATH 225N Week 3 Central Tendancy Questions and answers.
MATH 225N Week 3 Central Tendancy Questions and answers. Week 3 Questions Given the following box-and-whisker plot, decide if the data is skewed or symmetrical. Select the correct answer below: The data are skewed to the left. The data are skewed to the right. The data are symmetric. Which of the following frequency tables show a skewed data set? Select all answers that apply. Select all that apply: Select all that apply: Value Frequency 5 2 6 5 7 9 8 15 9 18 10 24 11 19 12 15...
 LOVELY01

Voordeelbundel
MATH 225N Week 8 Stats Assignment: Correlation and Causation (2020)
MATH 225N Week 8 Stats Assignment: Correlation and Causation (2020),MATH 225N Week 1 Assignment Sampling Methods – Questions and Answers{GRADED A}2020,MATH 225N WEEK 4 HOMEWORK PROBABILITY QUESTION AND ANSWERS,MATH 225N Week 4 Probability Questions and answers(All Correct Answers),MATH 225N Week 5 Assignment: Central Limit Theorem for Proportions-P
ELITESOLUTIONS
Voordeelbundel
MATH 225N Week 5 Assignment: Central Limit Theorem for Proportion
MATH 225N Week 4 Probability Questions and answers(All Correct Answers) Exam (elaborations) Math 225N Week 5 Assignment (2020) - Central Limit Theorem for Proportions. Graded A Exam (elaborations) MATH 225 WEEK 5 LAB ASSIGNMENT: (LATEST, 2021): CHAMBERLAIN COLLEGE OF NURSING |100% CORRECT ANSWERS, DOWNLOAD TO SCORE A| Exam (elaborations) MATH
ELITESOLUTIONS
Tentamen (uitwerkingen)
Math 225N Week 4 Homework Probability Question And Answers
MATH 225N WEEK 4 HOMEWORK PROBABILITY QUESTION AND ANSWERS 1. Which of the pairs of events below is dependent? ________________________________________ Select the correct answer below: ________________________________________ drawing a 7 and then drawing another 7 with replacement from a standard deck of cards rolling a 1 and then rolling a 6 with a standard die rolling a 3 and then rolling a 4 with a standard die drawing a heart and then drawing a spade without replacement from a st...
 Topesttutor1