Boxplot Samenvattingen, Notities en Examens
Op zoek naar een samenvatting over Boxplot? Op deze pagina vind je 315 samenvattingen over Boxplot.
Pagina 4 van de 315 resultaten
Sorteer op
-
Introduction to Statistics Notes Latest Verified Review 2023 Practice Questions and Answers for Exam Preparation, 100% Correct with Explanations, Highly Recommended, Download to Score A+
- Samenvatting • 20 pagina's • 2023
- €9,93
- + meer info
Introduction to Statistics Notes Latest Verified Review 2023 Practice Questions and Answers for Exam Preparation, 100% Correct with Explanations, Highly Recommended, Download to Score A+ Covers basic graphs and descriptive statistics for both categorical and quantitative variables This is what you would do as a “preliminary analysis” for a variable. Recall: a data set can have multiple variables in it. These chapters focus on mostly univariate (single variable) analyses. There is on...
-
MATH 302: INTRODUCTION TO PROBABILITY FINAL EXAM 2022/2023(MAY-AUGUST QTR) 100% CORRECT AND VRIFIED ANSWERS FOR DISTINTION PASS (Highly RECOMMENDED)
- Tentamen (uitwerkingen) • 66 pagina's • 2023
- €14,19
- + meer info
Question 1 of 20 1.0/ 1.0 Points Which of the following statements are false regarding a boxplot? A. The height of the box has no significance. B. Boxplots can be used to either describe a single variable in a data set or to compare two (or more) variables C. The length of the box equals the range of the data. D. The right and left of the box are the third and first quartiles Answer Key: C Question 2 of 20 1.0/ 1.0 Points A histogram that has a single peak and looks approximatel...
-
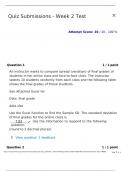
MATH302 Week 2 Test
- Tentamen (uitwerkingen) • 19 pagina's • 2023
- €27,91
- + meer info
1. Question: An instructor wants to compare spread (variation) of final grades of students in her online class and face-to-face class. The instructor selects 10 students randomly from each class and the following table shows the final grades of those students. See Attached Excel for Data. 2. Question: The lengths (in kilometers) of rivers on the South Island of New Zealand that flow to the Tasman Sea are listed below. Find the variance. See Attached Excel for Data. Use the Excel function to fin...
-
Probability and Statistics, WGU C955 Questions & Answers (Graded A)
- Tentamen (uitwerkingen) • 4 pagina's • 2023
- €9,45
- + meer info
Probability and Statistics, WGU C955 Questions & Answers (Graded A) Boxplot - ANSWER-an image that has min, Q1, median, Q3, max Histogram - ANSWER-A graphical representation -- bars, measuring the frequency within each interval Skewed right - ANSWER-Not a symmetric distribution, the tail is on the right, i.e. extra stuff on the right Measures of center - ANSWER-Median, the mean (and mode) Measures of spread - ANSWER-Range, IQR & standard deviation Standard Deviation Rule - AN...
-
MATH 302| STATISTICS| MIDTERM EXAM WITH CORRECT ANSWERS 2024| GRADED A
- Tentamen (uitwerkingen) • 10 pagina's • 2024
- €10,87
- + meer info
MATH 302| STATISTICS| MIDTERM EXAM WITH CORRECT ANSWERS 2024| GRADED A Part 1 of 9 - Question 1 of 25 1.0 Points For a boxplot, the vertical line inside the box indicates the location of the • A. mean • B. median • C. inter quartile range • D. mode Part 2 of 9 -

Wil jij je uitgaves terugverdienen?

-
Lean Six Sigma Yellow Belt Questions & Answers 100% Correct
- Tentamen (uitwerkingen) • 5 pagina's • 2024
- €11,35
- + meer info
Solutions are implemented in which stage of DMAIC? - ANSWERImprove and Control What does DMAIC stand for? - ANSWERDefine, Measure, Analyze, Improve, Control pareto chart - ANSWERcategorical x vs categorical y run chart - ANSWERcontinuous y vs time boxplot - ANSWERcontinuous y vs categorical x scatter plot - ANSWERcontinuous y vs continuous x what information does a dotplot provide? - ANSWERthe spread of the data spaghetti diagrams - ANSWERvisual representation of the work un...
-
Statistics final wgu academy exam questions and answers
- Tentamen (uitwerkingen) • 6 pagina's • 2024
- €9,55
- + meer info
Statistics final wgu academy exam questions and answers Categorical variables that there is no natural order among the categories nominal variables Categorical variables where there is natural order among the categories (low-high) ordinal variable A measurement which makes sense to talk about the difference between values but not the ratio between values interval Quantitive variables where is makes sense to talk about the difference in ratios. (Income, weight) ratio Valu...
-
Probability and Statistics, WGU C955 | 51 Questions and answers with 100% correct solutions | Graded A+
- Tentamen (uitwerkingen) • 6 pagina's • 2024
- €11,81
- + meer info
Boxplot an image that has min, Q1, median, Q3, max Histogram A graphical representation -- bars, measuring the frequency within each interval Skewed right Not a symmetric distribution, the tail is on the right, i.e. extra stuff on the right Measures of center Median, the mean (and mode) Measures of spread Range, IQR & standard deviation Standard Deviation Rule 68% of the data are within 1 standard deviation, 95% are within 2, 99.7 are within 3 standard deviations from the mean. For skewed...
-
MATH 302: STATISTICS BEC1 FINAL EXAM 2022/2023(MAY-AUGUST QTR) 100% CORRECT AND VRIFIED ANSWERS FOR DISTINTION PASS (Highly RECOMMENDED)
- Tentamen (uitwerkingen) • 66 pagina's • 2023
- €13,24
- + meer info
Question 1 of 20 1.0/ 1.0 Points Which of the following statements are false regarding a boxplot? A. The height of the box has no significance. B. Boxplots can be used to either describe a single variable in a data set or to compare two (or more) variables C. The length of the box equals the range of the data. D. The right and left of the box are the third and first quartiles Answer Key: C Question 2 of 20 1.0/ 1.0 Points A histogram that has a single peak and looks approximatel...
-
Seeing Through Statistics 4th Edition by Utts - Test Bank
- Tentamen (uitwerkingen) • 196 pagina's • 2023
- €22,36
- + meer info
CHAPTER 3 MEASUREMENTS, MISTAKES, AND MISUNDERSTANDINGS SECTION 3.1 SIMPLE MEASURES DON’T EXIST FREE RESPONSE QUESTIONS 1. Explain why even the simplest kind of measurement, such as finding your height, still presents complicated issues. ANSWER: ANY REASONABLE ANSWER OK. EXAMPLES: THE ACCURACY OF YOUR MEASUREMENT DEPENDS ON YOUR MEASUREMENT TOOL; HOW TALL YOU STAND WHEN YOU MEASURE; WHETHER OR NOT YOU WEAR SHOES, ETC. 2. Describe one of the issues that you would need to think about when...
