
MATH225N (MATH225N)
Chamberlain College Of Nursing
Here are the best resources to pass MATH225N (MATH225N). Find MATH225N (MATH225N) study guides, notes, assignments, and much more.
Exam (elaborations)
MATH 225N Week 2 Discussion: Graphing and Describing Data in Everyday Life
MATH 225N Week 2 Discussion: Graphing and Describing Data in Everyday Life
 CollegeProfessor
Exam (elaborations)
MATH 225N Week 1 Discussion: Basic Statistics Data Used in Everyday Life – Temperature
MATH 225N Week 1 Discussion: Basic Statistics Data Used in Everyday Life – Temperature
CollegeProfessor
Exam (elaborations)
MATH 225N Week 8 Assignment Linear Regression Equations
MATH 225N Week 8 Assignment Linear Regression Equations
CollegeProfessor
Exam (elaborations)
MATH 225N Week 7 Assignment: Hypothesis Test for the Mean – Population Standard Deviation Known
MATH 225N Week 7 Assignment: Hypothesis Test for the Mean – Population Standard Deviation Known
CollegeProfessor

Exam (elaborations)
MATH 225N Week 7 Lab Assignment (Fall Session){GRADED A}
Steps to Complete the Week 7 Lab Step 1: Find these articles in the Chamberlain Library. Once you click each link, you will be logged into the Library and then click on “PDF Full Text”. First Article: Confidence Intervals, Part 1 (Links to an external site.) Second Article: Confidence Intervals, Part 2 (Links to an external site.) Step 2: Consider the use of confidence intervals in health sciences with these articles as inspiration and insights. Step 3: Using the data you collected for th...
 academicmaster
Package deal
MATH 225N Week 5 Bundle: Homework Assignments, Lab Assignment, Discussion
MATH 225N Week 5 Assignment: Lab (Version 1, Version 2) MATH-225N Week 5 Assignment: Applications of the Normal Distribution – Excel MATH 225N Week 5 Assignment: Central Limit Theorem for Proportions MATH-225N Week 5 Assignment: Central Limit Theorem for Means MATH 225N Week 5 Assignment: Evaluating Probability Using the Normal Distribution MA
academicmaster
Study guide
Math 225N Week 7 Assignment: Construct Hypothesis Test For Proportions
Math 225N Week 7 Assignment: Construct Hypothesis Test For Proportions
 Solutionmaster
Study guide
Week 7 Assignment Hypothesis Test for the Mean - Population Standard- GRADED A Deviation Known
Week 7 Assignment Hypothesis Test for the Mean - Population Standard Deviation Known
Solutionmaster
Study guide
MATH 225N Week 7 Assignment: Hypothesis Test for the Mean – Population Standard Deviation Known{100%}
1. Question: .Jamie, a bowler, claims that her bowling score is less than 168 points, on average. Several of her teammates do not believe her, so she decides to do a hypothesis test, at a 1% significance level, to persuade them. She bowls 17 The mean score of the sample games is 155 points. Jamie knows from experience that the standard deviation for her bowling score is 19 points. H0: μ≥168; Ha: μ<168 α=0.01 (significance level) What is the test statistic (z-score) of this one-mean hypo...
academicmaster
Study guide
MATH 225N Week 7 Assignment Conduct a Hypothesis Test for Proportion – P-Value Approach{100%}
Question: A teacher claims that the proportion of students … to pass an exam is greater than 80%. To test this claim, the teacher administers the test to 200 random students and determines that 151 students pass the exam. Question: A hospital administrator claims that the proportion of knee surgeries that are successful is 87%. To test this claim, a random sample of 450 patients who underwent knee surgery is taken and it is determined that 371 of these patients had a successful knee surgery o...
academicmaster
Study guide
MATH 225N Week 7 Assignment: Construct Hypothesis Test for Proportions – Excel{100%}
1. Question: Steve listens to his favorite streaming music service when he works out. He wonders whether the service’s algorithm does a good job of finding random songs that he will like more often than not. To test this, he listens to 50 songs chosen by the service at random and finds that he likes 32 of them…… Use Excel to test whether Steve will like a randomly selected song more often than not, and then draw a conclusion in the context of the problem. Use α=0.05. 2. Question: A magaz...
academicmaster
Exam (elaborations)
MATH 225N Week 7 Hypothesis Testing: Questions-Answers{100%}
Question: Steve listens to his favorite streaming music service when he works out. He wonders whether the service algorithm does a good job of finding random songs that he will like more often than not. To test this, he listens to 50 songs chosen by the service at random and finds that he likes 32 of them. Question: A magazine regularly tested products and gave the reviews to its customers. In one of its reviews, it tested 2 types of batteries and claimed that the batteries from company A outp...
academicmaster
Study guide
MATH 225N Week 7 Lab Assignment (Spring Session){100%}
teps to Complete the Week 7 Lab Step 1: Find these articles in the Chamberlain Library. Once you click each link, you will be logged into the Library and then click on “PDF Full Text”. First Article: Confidence Intervals, Part 1 (Links to an external site.) Second Article: Confidence Intervals, Part 2 (Links to an external site.) Step 2: Consider the use of confidence intervals in health sciences with these articles as inspiration and insights. Step 3: Using the data you collected for t...
academicmaster
Study guide
MATH 225N Week 5 Assignment: Evaluating Probability Using the Normal Distribution{GRADED A}
Question: Wilson’s math test scores are … with a mean score of 73 (μ) and a standard deviation of 5 (σ). Using the Empirical Rule, about 99.7% of the scores lie between which two values? Question: Miller’s geometry test scores are … with a mean score of 70 (μ) and a standard deviation of 3 (σ). Using the Empirical Rule, about 95% of the scores lie between which two values? Question: Wilson’s statistics test scores are … with a mean score of 72 (μ) and a standard deviation of 3 (...
academicmaster
Study guide
MATH 225N Week 5 Understanding the Empirical Rule{GRADED A}2022
MATH 225N Week 5 Understanding the Empirical Rule Question: A random sample of CO2 levels in a school has a sample mean of x¯=4 ppm and sample standard deviation of s=86.7 ppm. Use the Empirical Rule to determine the approximate percentage of CO2 levels that lie between 338.3 and 858.5 ppm. Question: Suppose that a random sample of redwood trees has a sample mean diameter of x¯=1 feet, with a sample standard deviation of s=3.7 feet. Since the diameters of redwood trees are generally symmetr...
academicmaster
Study guide
MATH 225N Week 5 Understanding Normal Distribution{GRADED A}
MATH 225N Week 5 Understanding Normal Distribution Question: Lexie averages 149 points per bowling game with a standard deviation of 14 Suppose Lexie’s points per bowling game are … Let X= the number of points per bowling game. Then X∼N(149,14). Question: Suppose X∼N(18,2), and x=22. Find and interpret the z-score of the standardized normal random variable. Question: Suppose X∼N(5,1.5), and x=11. Find and interpret the z-score of the standardized normal random variable. Isabella averag...
academicmaster
Study guide
MATH 225N Week 5 Understanding Normal Distribution (From the Video){100%}
MATH 225N Week 5 Understanding Normal Distribution (From the Video) Question: In2014, the CDC estimated that the mean height for adult women in the U.S. was 64 inches with a standard deviation of 4 Suppose X, height in inches of adult women, follows a normal distribution. Let x=68, the height of a woman who is 5′ 8″ tall. Find and interpret the z-score of the standardized normal random variable. Question: The graph below shows the graphs of several normal distributions, labeledA, B, and C, o...
academicmaster
Study guide
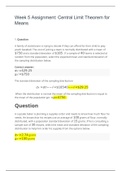
MATH 225N Week 5 Assignment: Central Limit Theorem for Means{GRADED A}
Question: A family of statisticians is trying to decide if they can afford for their child to play youth baseball. The cost of joining a team is normally distributed with a mean of $750and a standard deviation of $185. If a sample of 40teams is … at random from the population, select the expected mean and standard deviation of the sampling distribution below. Question: A cupcake baker is planning a supplies order and needs to know how much flour he needs. He knows that his recipes use an aver...
academicmaster
Study guide
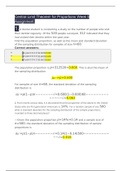
MATH 225N Week 5 Assignment: Central Limit Theorem for Proportions{100%}
Question: A dental student is conducting a study on the number of people who visit their dentist regularly. Of the 520 people surveyed, 312 indicated that they had visited their dentist within the past year. Find the population proportion, as well as the mean and standard deviation of the sampling distribution for samples of size n=60. Question: From recent census data, it is discovered that the proportion of the adults in the United States who are first generation Americans is 14%. For a rando...
academicmaster
Study guide
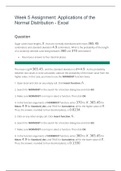
MATH 225N Week 5 Assignment: Applications of the Normal Distribution – Excel{100%}
Question: Sugar canes have lengths, X, that are normally distributed with mean 45centimeters and standard deviation 4.9centimeters. What is the probability of the length of a randomly selected cane being between 360and 370centimeters? Round your answer to four decimal places. Question: The number of miles a motorcycle, X, will travel on one gallon of gasoline is modeled by a normal distribution with mean 44 and standard deviation 5. If Mike starts a journey with one gallon of gasoline in the mot...
academicmaster