

Research Methods in Finance
Research Methods in Finance is also often called Financial Econometrics. Econometrics means
measurement in economics.
There is a difference between Financial Econometrics and Economic Econometrics!! THEY ARE NOT
THE SAME!!!
Economic data: you don’t have a lot of data ➔ only 4 data points each year, so each quarter (e.g.
GDP: data for 4 quarters)
Financial data = if you have a lot of data ➔ (bv. Stock prices: have much more data. You have data
points for each trading day a year = financial econometrics)
Bij stock prices heb je zelf intraday data, it means you have different data points during 1 day
ADVANTAGE: Less exposed to:
• Small samples problem (because you have a lot of data)
• Measurement error
• Data revisions (you can review data when you have new information)
DISADVANTAGE: !!! Financial data can be noisy !!! = not easy to explain what is happening. There is
a lot of ‘randomness’, without being able to explain what is happening. It has to do something
with how people trade. Big challenge = disentangle what is noise and what is really driven by
fundamental (dus onderscheiden wat random is en wat effectief iets aangeeft)
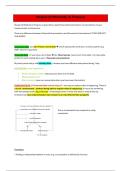
This is a framework how research is really
conducted.
Functions
= finding a relationship between x and y (e.g. consumption is defined by income)
,y = f (x )
A function can be linear but can also be non-linear. Most of the times the function will be linear.
Linear function: y = a + bx (y and x are variables)
Non-linear function: y = a + bx² (a and b are parameters, a is the intercept and b is the slope)
The black line is a linear function ➔ y = 25 + 0.05x
The blue function is a non-linear function ➔ y
= 25 + 0.05x²
Example of a non-linear function: from a given point studying more than you already have has no
impact anymore
Different types of financial data:
• cross-sectional data = having data on one or more variables collected at one specific point
in time (e.g. in 2025) , but over different cross sections (e.g. over different countries)
• Time-series data = looking at data for 1 specific company/country/… over time
IMPORTANT !!! Data in a model should have the same frequency of observation !!!
(e.g. not possible to compare stock market performance that can be viewed on daily level and GDP
that is only available on quarterly basis.)
• Panel data = variable data which is changing over time over different cross-sections
Pooled data → panel data: Pooled data treats panel data as a larger cross-sectional sample
!!! AGGREGATION !!!
= process of combining or summarizing detailed data into a broader, more general measure.
= summarizing detailed information into higher-level summaries.
Non-aggregated data: Individual house prices for every property (lots of detail).
,Aggregated data: Average house price in a city, region, or country (less detail, but provides a big-
picture view).
➔ Using aggregate data makes you see the bigger picture, but you lose a lot of detail.
Qualitative and quantitative data
Quantitative data = numerical (e.g. share price is €25)
Qualitative data ≠ numerical (e.g. in a survey you ask how good the colleagues feel)
Dummy variables = variables that can only have two values ➔ 0 or 1 We use this to turn
qualitative variables into quantitative variables.
Primary data → secondary data
primary data = new data, you collect them yourself.
➔ disadvantage it takes time to collect them → advantage = the data you use is unique
Secondary data = you use data which is collected by someone else. You can find them in a database
➔ disadvantage: it can be expensive → advantage: less time consuming
Obtaining data
Secondary data can be collected in different databases. They are often quite expensive. There are
also some free data sources.
- Economic and financial data about the us ➔ Federal Reserve Bank of St Louis
- Financial data worldwide ➔ Yahoo Finance
- Belgian data ➔ NBB
Dealing with data
Data transformation
The data that is collected often has to be transformed to be useful.
(e.g. data collected: X = number of shares, Y = company earnings ➔ to compare with other
companies you need Y/X = earnings per share)
, Some transformations are often used with asset prices:
Relative change of the asset price = R(t) = total return index Pt = Price in
period t * (nieuw – oud)/oud
➔ This formula is ≈
!!! This formulas ignore dividends !! ➔ It’s important to add them back, because the price of a
company decreases when they pay out dividends. When you want to compare companies, you
have to add them back !!!
Real → nominal series:
Due to inflation, prices tend to rise over time. (e.g. if the house prices increase, is this due to
inflation or due to increasing demand of houses? (can be both))
It’s important to watch those effects separately. This you can do by deflating a series, or
expressing values at constant prices!!!
Deflator = CPI(t) / CPI(0) met CPI = consumer price index
(e.g.: CPI compared with base year 2004 ➔ CPI (2013) = 123.6 CPI (2004) = 100 nominal
house prices in 2013 = 162.245
Real series = 162.245 / (123.6/100) * 100 = 131.266)
The program “R”
R is an open-source programming language for statistics computing and graphics. This program will
be trained in Financial Services Analytics.
3 types of windows:
• Console window: here you execute demands and here the output is displayed
• Environment window: shows the data and variables that have been loaded and created
• Plot window: shows graphical output
In this course we will use “R notebooks”. In this we can combine text, code and output all together
in a Notebook.
Things that are shown on a yearly basis in %, you need to divide them by 12 to express it on a monthly
basis.
Research Methods in Finance is also often called Financial Econometrics. Econometrics means
measurement in economics.
There is a difference between Financial Econometrics and Economic Econometrics!! THEY ARE NOT
THE SAME!!!
Economic data: you don’t have a lot of data ➔ only 4 data points each year, so each quarter (e.g.
GDP: data for 4 quarters)
Financial data = if you have a lot of data ➔ (bv. Stock prices: have much more data. You have data
points for each trading day a year = financial econometrics)
Bij stock prices heb je zelf intraday data, it means you have different data points during 1 day
ADVANTAGE: Less exposed to:
• Small samples problem (because you have a lot of data)
• Measurement error
• Data revisions (you can review data when you have new information)
DISADVANTAGE: !!! Financial data can be noisy !!! = not easy to explain what is happening. There is
a lot of ‘randomness’, without being able to explain what is happening. It has to do something
with how people trade. Big challenge = disentangle what is noise and what is really driven by
fundamental (dus onderscheiden wat random is en wat effectief iets aangeeft)
This is a framework how research is really
conducted.
Functions
= finding a relationship between x and y (e.g. consumption is defined by income)
,y = f (x )
A function can be linear but can also be non-linear. Most of the times the function will be linear.
Linear function: y = a + bx (y and x are variables)
Non-linear function: y = a + bx² (a and b are parameters, a is the intercept and b is the slope)
The black line is a linear function ➔ y = 25 + 0.05x
The blue function is a non-linear function ➔ y
= 25 + 0.05x²
Example of a non-linear function: from a given point studying more than you already have has no
impact anymore
Different types of financial data:
• cross-sectional data = having data on one or more variables collected at one specific point
in time (e.g. in 2025) , but over different cross sections (e.g. over different countries)
• Time-series data = looking at data for 1 specific company/country/… over time
IMPORTANT !!! Data in a model should have the same frequency of observation !!!
(e.g. not possible to compare stock market performance that can be viewed on daily level and GDP
that is only available on quarterly basis.)
• Panel data = variable data which is changing over time over different cross-sections
Pooled data → panel data: Pooled data treats panel data as a larger cross-sectional sample
!!! AGGREGATION !!!
= process of combining or summarizing detailed data into a broader, more general measure.
= summarizing detailed information into higher-level summaries.
Non-aggregated data: Individual house prices for every property (lots of detail).
,Aggregated data: Average house price in a city, region, or country (less detail, but provides a big-
picture view).
➔ Using aggregate data makes you see the bigger picture, but you lose a lot of detail.
Qualitative and quantitative data
Quantitative data = numerical (e.g. share price is €25)
Qualitative data ≠ numerical (e.g. in a survey you ask how good the colleagues feel)
Dummy variables = variables that can only have two values ➔ 0 or 1 We use this to turn
qualitative variables into quantitative variables.
Primary data → secondary data
primary data = new data, you collect them yourself.
➔ disadvantage it takes time to collect them → advantage = the data you use is unique
Secondary data = you use data which is collected by someone else. You can find them in a database
➔ disadvantage: it can be expensive → advantage: less time consuming
Obtaining data
Secondary data can be collected in different databases. They are often quite expensive. There are
also some free data sources.
- Economic and financial data about the us ➔ Federal Reserve Bank of St Louis
- Financial data worldwide ➔ Yahoo Finance
- Belgian data ➔ NBB
Dealing with data
Data transformation
The data that is collected often has to be transformed to be useful.
(e.g. data collected: X = number of shares, Y = company earnings ➔ to compare with other
companies you need Y/X = earnings per share)
, Some transformations are often used with asset prices:
Relative change of the asset price = R(t) = total return index Pt = Price in
period t * (nieuw – oud)/oud
➔ This formula is ≈
!!! This formulas ignore dividends !! ➔ It’s important to add them back, because the price of a
company decreases when they pay out dividends. When you want to compare companies, you
have to add them back !!!
Real → nominal series:
Due to inflation, prices tend to rise over time. (e.g. if the house prices increase, is this due to
inflation or due to increasing demand of houses? (can be both))
It’s important to watch those effects separately. This you can do by deflating a series, or
expressing values at constant prices!!!
Deflator = CPI(t) / CPI(0) met CPI = consumer price index
(e.g.: CPI compared with base year 2004 ➔ CPI (2013) = 123.6 CPI (2004) = 100 nominal
house prices in 2013 = 162.245
Real series = 162.245 / (123.6/100) * 100 = 131.266)
The program “R”
R is an open-source programming language for statistics computing and graphics. This program will
be trained in Financial Services Analytics.
3 types of windows:
• Console window: here you execute demands and here the output is displayed
• Environment window: shows the data and variables that have been loaded and created
• Plot window: shows graphical output
In this course we will use “R notebooks”. In this we can combine text, code and output all together
in a Notebook.
Things that are shown on a yearly basis in %, you need to divide them by 12 to express it on a monthly
basis.


