F~ction Vocab+ Rates of Change (1.1-1.3) Homework
4 o
f(x)
\
1 2 3 4 5 6 7 8
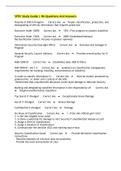
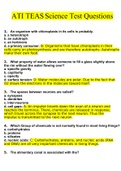
Consider f(x) graphed above. Let A, B, C, D, E, F, and G be the x-coordinates of the labelled points.
. c-2,-:r-~ Gl,'-1]
1. Identify the domain and range off (x). Express in interval notation. ('5 61
2. Over what interval(s) does f(x) increase? Give your answer in interval notation. C-1, (J \) 1
3. Over what interval(s) does f(x) decrease? Give your answer in interval notation. C 1/iJ U [ ' ':'.tJ
1
4. Find the average rate of change off (x) over the interval 0 $ x $ 4. Lo,~) l't 1 I ) _!::2._ -=-/--
2]
4-0
5. What is the absolute maximum value off (x)? L-{
6. Find the global minimum value of f(x)? - I
7. List all x-_.,values at which f(x) has local maxima.x-=(,,
8. List q.U x:..values at which f(x) has relative ."'!inima. x::-1, ?1 1-
9. Identify all zeros off (x). )< ::-( ?
1
10. Which is greater, the rate of change off (x) at x = 0 or the rate of change of f(x) at x = 2? Provide your
rationale. X-=-o,c.\J!r-fl\a:t 1s o... po~;-\-i\Je.6ltl~1X::'l i-s f\~\Je.
11. Put the following in order from least to greatest:
I) The average rate of change of f(x) over the interval [E, G] /
II) The average rate of change off (x) over the interval [A, C]-
T\J 1]Ir, Il ;5[., I
111) rhe average rate of ~hange off (x) over the interval [B, F]........_
IV) The average rate of change off (x) over the interval [B, D] "-
V) The average rate of change off (x) over the interval [D, F]/
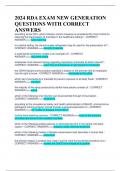
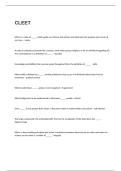
~2. Consider the function g(x) graphed to the right. Rank the
following in order from least to greatest: .
1 5
I) The rate of change of g(x) at x = 1
4
II) The rate of change of g(x) at x = 3
Ill) The average rate of change of g(x) over the interval [1,2]
3
IV) The average rate of change of g(x) over the interval [1,3]
, . 2
[(,?.]-? (l,I.~) (1,2) 1
::.~.5
-1 0 1 2 3 4
Ll, ~]~ (t,·,.i;) ~g,t·t~) -1
~::l."t
'2.
CBHS AP Precalculus 2025/26 - Unit 1, Day 1 HW
4 o
f(x)
\
1 2 3 4 5 6 7 8
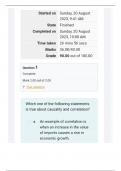
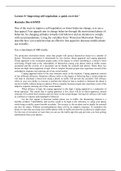
Consider f(x) graphed above. Let A, B, C, D, E, F, and G be the x-coordinates of the labelled points.
. c-2,-:r-~ Gl,'-1]
1. Identify the domain and range off (x). Express in interval notation. ('5 61
2. Over what interval(s) does f(x) increase? Give your answer in interval notation. C-1, (J \) 1
3. Over what interval(s) does f(x) decrease? Give your answer in interval notation. C 1/iJ U [ ' ':'.tJ
1
4. Find the average rate of change off (x) over the interval 0 $ x $ 4. Lo,~) l't 1 I ) _!::2._ -=-/--
2]
4-0
5. What is the absolute maximum value off (x)? L-{
6. Find the global minimum value of f(x)? - I
7. List all x-_.,values at which f(x) has local maxima.x-=(,,
8. List q.U x:..values at which f(x) has relative ."'!inima. x::-1, ?1 1-
9. Identify all zeros off (x). )< ::-( ?
1
10. Which is greater, the rate of change off (x) at x = 0 or the rate of change of f(x) at x = 2? Provide your
rationale. X-=-o,c.\J!r-fl\a:t 1s o... po~;-\-i\Je.6ltl~1X::'l i-s f\~\Je.
11. Put the following in order from least to greatest:
I) The average rate of change of f(x) over the interval [E, G] /
II) The average rate of change off (x) over the interval [A, C]-
T\J 1]Ir, Il ;5[., I
111) rhe average rate of ~hange off (x) over the interval [B, F]........_
IV) The average rate of change off (x) over the interval [B, D] "-
V) The average rate of change off (x) over the interval [D, F]/
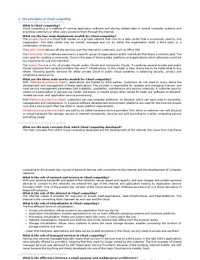
~2. Consider the function g(x) graphed to the right. Rank the
following in order from least to greatest: .
1 5
I) The rate of change of g(x) at x = 1
4
II) The rate of change of g(x) at x = 3
Ill) The average rate of change of g(x) over the interval [1,2]
3
IV) The average rate of change of g(x) over the interval [1,3]
, . 2
[(,?.]-? (l,I.~) (1,2) 1
::.~.5
-1 0 1 2 3 4
Ll, ~]~ (t,·,.i;) ~g,t·t~) -1
~::l."t
'2.
CBHS AP Precalculus 2025/26 - Unit 1, Day 1 HW