3/7/2024 Midterm II W 24 LS7B: Attempt review | Comprehensive Question & Answer | 100% Correct -The Ultimate Guide for Yr.
(2026/2027)
CCLE
Winter 20214 Week 9
My sites / -1 / Midterm II / Midterm II W 24 LS7B
Winter 2024 LIFESCI7B-1 - PIRES
Started on Monday, 22 February 2024, 2:02 PM PST
State Finished
Completed on Monday, 22 February 2024, 3:37 PM PST
Time taken 1 hour 34 mins
Grade 105.00 out of 123.00 (85%)
Information
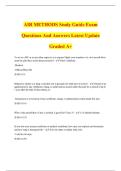
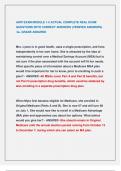
[Questions 1–3] The figures below show results from a series of observations on male tail length of the red bishop bird (Euplectes orix). The
figure on the left shows female preference for male tail length in experimental populations. The grey bars represent tail lengths manipulated
by researchers (they artificially added long feathers to the tails of the experimental birds). Probability of mating is a proxy for estimating the
ability of males to attract mates and have offspring. In thefigure on the right, the white bars represent observed variation in male tail length
in natural (i.e. wild) populations.
Question 1
Correct
3.00 points out of 3.00
The longer a male’s tail is, the more likely the male is to survive.
Select one:
True
False
Explain why sexual selection typically does not result in adaptation to the environment
Define sexual selection
Compare and contrast the mechanisms of natural and sexual selection.
The correct answer is 'False'.
https://ccle.ucla.edu/mod/quiz/review.php?attempt=5114209&cmid=3691165 1/34
,3/7/2024 Midterm II W 24 LS7B: Attempt review
Question 2
Correct
CCLE
3.00 points out of 3.00
Tail length is under stabilizing selection in wild populations.
Select one:
True
False
Explain why sexual selection typically does not result in adaptation to the environment
Define sexual selection
Compare and contrast the mechanisms of natural and sexual selection.
The correct answer is 'True'.
Question 3
Correct
3.00 points out of 3.00
In the wild population, sexual selection produces the adaptation of tails that are 7 cm in length.
Select one:
True
False
Explain why sexual selection typically does not result in adaptation to the environment
Define sexual selection
Compare and contrast the mechanisms of natural and sexual selection.
The correct answer is 'False'.
Information
[Questions 4–6] You’re studying one genetic locus in a population of 700 wombats. Within the population, 35% are AA, 40% are Aa, and
25% are aa.
2/34
,3/7/2024 Midterm II W 24 LS7B: Attempt review
Question 4
Incorrect
CCLE
0.00 points out of 3.00
What is the frequency of allele a in the population?
a. 0.40
b. None of the answer choices are correct
c. 0.45
d. 0.50
e. 0.55
Your answer is incorrect.
Evaluate each assumption of HW equilibrium and the effect violation of the assumptions may have on changing allele frequencies in a
population
Calculate genotype frequencies expected under HW equilibrium in a population given its allele frequencies
The correct answer is:
0.45
Question 5
Correct
3.00 points out of 3.00
This population is NOT in HW equilibrium
Select one:
True
False
Calculate allele frequencies based on phenotypic or genotypic data for a population
Calculate genotype frequencies expected under HW equilibrium in a population given its allele frequencies
State whether a population is evolving based on deviations from HW equilibrium
The correct answer is 'True'.
3/34
, 3/7/2024 Midterm II W 24 LS7B: Attempt review
Question 6
Correct
CCLE
3.00 points out of 3.00
If there is natural selection for heterozygotes, then the frequency of AA individuals will decrease in the population.
Select one:
True
False
Evaluate each assumption of HW equilibrium and the effect violation of the assumptions may have on changing allele frequencies in a
population
Explain how natural selection and genetic drift can affect the elimination, maintenance or increase in frequency of various types of alleles
(e.g. dominant, recessive, deleterious, beneficial) in a population.
Lab Week 5
The correct answer is 'True'.
Information
[Questions 7–8] The graph below shows the relationship between allele frequencies of two possible alleles for a gene in a population of a
diploid organism.
4/34
(2026/2027)
CCLE
Winter 20214 Week 9
My sites / -1 / Midterm II / Midterm II W 24 LS7B
Winter 2024 LIFESCI7B-1 - PIRES
Started on Monday, 22 February 2024, 2:02 PM PST
State Finished
Completed on Monday, 22 February 2024, 3:37 PM PST
Time taken 1 hour 34 mins
Grade 105.00 out of 123.00 (85%)
Information
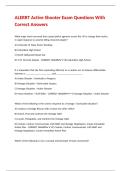
[Questions 1–3] The figures below show results from a series of observations on male tail length of the red bishop bird (Euplectes orix). The
figure on the left shows female preference for male tail length in experimental populations. The grey bars represent tail lengths manipulated
by researchers (they artificially added long feathers to the tails of the experimental birds). Probability of mating is a proxy for estimating the
ability of males to attract mates and have offspring. In thefigure on the right, the white bars represent observed variation in male tail length
in natural (i.e. wild) populations.
Question 1
Correct
3.00 points out of 3.00
The longer a male’s tail is, the more likely the male is to survive.
Select one:
True
False
Explain why sexual selection typically does not result in adaptation to the environment
Define sexual selection
Compare and contrast the mechanisms of natural and sexual selection.
The correct answer is 'False'.
https://ccle.ucla.edu/mod/quiz/review.php?attempt=5114209&cmid=3691165 1/34
,3/7/2024 Midterm II W 24 LS7B: Attempt review
Question 2
Correct
CCLE
3.00 points out of 3.00
Tail length is under stabilizing selection in wild populations.
Select one:
True
False
Explain why sexual selection typically does not result in adaptation to the environment
Define sexual selection
Compare and contrast the mechanisms of natural and sexual selection.
The correct answer is 'True'.
Question 3
Correct
3.00 points out of 3.00
In the wild population, sexual selection produces the adaptation of tails that are 7 cm in length.
Select one:
True
False
Explain why sexual selection typically does not result in adaptation to the environment
Define sexual selection
Compare and contrast the mechanisms of natural and sexual selection.
The correct answer is 'False'.
Information
[Questions 4–6] You’re studying one genetic locus in a population of 700 wombats. Within the population, 35% are AA, 40% are Aa, and
25% are aa.
2/34
,3/7/2024 Midterm II W 24 LS7B: Attempt review
Question 4
Incorrect
CCLE
0.00 points out of 3.00
What is the frequency of allele a in the population?
a. 0.40
b. None of the answer choices are correct
c. 0.45
d. 0.50
e. 0.55
Your answer is incorrect.
Evaluate each assumption of HW equilibrium and the effect violation of the assumptions may have on changing allele frequencies in a
population
Calculate genotype frequencies expected under HW equilibrium in a population given its allele frequencies
The correct answer is:
0.45
Question 5
Correct
3.00 points out of 3.00
This population is NOT in HW equilibrium
Select one:
True
False
Calculate allele frequencies based on phenotypic or genotypic data for a population
Calculate genotype frequencies expected under HW equilibrium in a population given its allele frequencies
State whether a population is evolving based on deviations from HW equilibrium
The correct answer is 'True'.
3/34
, 3/7/2024 Midterm II W 24 LS7B: Attempt review
Question 6
Correct
CCLE
3.00 points out of 3.00
If there is natural selection for heterozygotes, then the frequency of AA individuals will decrease in the population.
Select one:
True
False
Evaluate each assumption of HW equilibrium and the effect violation of the assumptions may have on changing allele frequencies in a
population
Explain how natural selection and genetic drift can affect the elimination, maintenance or increase in frequency of various types of alleles
(e.g. dominant, recessive, deleterious, beneficial) in a population.
Lab Week 5
The correct answer is 'True'.
Information
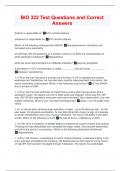
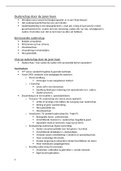
[Questions 7–8] The graph below shows the relationship between allele frequencies of two possible alleles for a gene in a population of a
diploid organism.
4/34