PEARSON EDEXCEL LEVEL 3 GCE 9ST0/03 STATISTICS ADVANCED
PAPER 3 : STATISTICS IN PRACTICE + MARK SCHEME JUNE 2025
Candidate surname Other names
Centre Number Candidate Number
Paper
Statistics
🟐 🟐
Advanced
PAPER 3 : Statistics in Practice
Marks
Statistical formulae and tables booklet
Calculator
Candidates may use any calculator allowed by Pearson regulations.
Calculators must not have retrievable mathematical formulae stored in them.
Instructions
•• Use black ink or ball‑point pen.
• Fill
If pencil is used for diagrams/sketches/graphs it must be dark (HB or B).
in the boxes at the top of this page with your name,
• Answer
centre number and candidate number.
all questions and ensure that your answers to parts of questions are
• Answer
clearly labelled.
the questions in the spaces provided
• You
– there may be more space than you need.
should show sufficient working to make your methods clear.
Answers without working may not gain full credit.
•• Unless otherwise stated, inexact answers should be given to three significant figures.
Unless otherwise stated, statistical tests should be carried out at the
5% significance level.
Information
•• AThere
booklet ‘Statistical formulae and tables’ is provided.
• The are 6for
marks questions in this question
each question are shownpaper. The total mark for this paper is 80.
in brackets
– use this as a guide as to how much time to spend on each question.
Advice
• Read each question carefully before you start to answer it.
•• Check answer
Try to
your
every question.
answers if youabout
haveantime at the cross
end. it out and put your new answer
If you change your mind answer,
and any working underneath. Turn over
P76383A
©2025 Pearson Education Ltd.
Y:1/1/1/1/1/
,DO NOT WRITE IN THIS AREA DO NOT WRITE IN THIS AREA
■■■■
BLANK PAGE
2
, Answer ALL questions. Write your answers in the spaces provided.
1 A study in 2021 investigated the number of hail days in a large European area covering
DO NOT WRITE IN THIS AREA
Germany, France, Belgium and Luxembourg.
A hail day was defined as one in which a radar detected the conditions necessary for
hail to occur anywhere within this area. Over the past 20 years, the mean number of
hail days in a year in this area was 86
[Source : www.doi.org/10.5194/nhess‑21‑683‑2021]
(a) Find the probability that
(i) in a randomly chosen year there would be at least 90 hail days,
(2)
(ii) in a randomly chosen two‑year period, there are no more than 160 hail days.
DO NOT WRITE IN THIS AREA
(2)
(b) State two assumptions needed, in the context of this question, to calculate the
probabilities in (a) and in each case give a reason why that assumption may not
be appropriate.
(4)
DO NOT WRITE IN THIS AREA
(Total for Question 1 is 8 marks)
3
■■■■ Turn over
, 2 A small company based in the tourism industry is trying to decide where best to spend
its advertising budget in order to attract more visitors.
DO NOT WRITE IN THIS AREA
It is comparing the visitor numbers to mainland UK from France and from Ireland in
different periods of time.
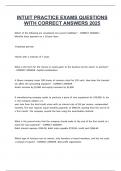
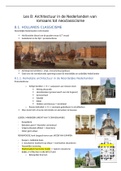
Figure 1 shows the number of visitors from France and from Ireland for a randomly
selected series of yearly quarters. Visitor numbers have been rounded to the
nearest 1000
Quarter
2019 Q2 2019 Q3 2021 Q1 2021 Q3 2022 Q1 2022 Q3 2022 Q4
France 929 000 898 000 13 000 148 000 462 000 697 000 842 000
Country
Ireland 718 000 716 000 24 000 247 000 417 000 640 000 731 000
Figure 1
[Source : www.ons.gov.uk/peoplepopulationandcommunity/leisureandtourism]
DO NOT WRITE IN THIS AREA
In some quarters, the number of visitors from France exceeds that from Ireland, whilst
in others the reverse is true. The data is also clearly impacted by changes in travel
patterns following the pandemic.
You should assume that the difference between the numbers of visitors from France and
Ireland is not symmetrically distributed.
(a) Carry out a suitable hypothesis test to determine whether there is a difference
between the average number of visitors to mainland UK from the two countries.
(6)
DO NOT WRITE IN THIS AREA
4
■■■■
PAPER 3 : STATISTICS IN PRACTICE + MARK SCHEME JUNE 2025
Candidate surname Other names
Centre Number Candidate Number
Paper
Statistics
🟐 🟐
Advanced
PAPER 3 : Statistics in Practice
Marks
Statistical formulae and tables booklet
Calculator
Candidates may use any calculator allowed by Pearson regulations.
Calculators must not have retrievable mathematical formulae stored in them.
Instructions
•• Use black ink or ball‑point pen.
• Fill
If pencil is used for diagrams/sketches/graphs it must be dark (HB or B).
in the boxes at the top of this page with your name,
• Answer
centre number and candidate number.
all questions and ensure that your answers to parts of questions are
• Answer
clearly labelled.
the questions in the spaces provided
• You
– there may be more space than you need.
should show sufficient working to make your methods clear.
Answers without working may not gain full credit.
•• Unless otherwise stated, inexact answers should be given to three significant figures.
Unless otherwise stated, statistical tests should be carried out at the
5% significance level.
Information
•• AThere
booklet ‘Statistical formulae and tables’ is provided.
• The are 6for
marks questions in this question
each question are shownpaper. The total mark for this paper is 80.
in brackets
– use this as a guide as to how much time to spend on each question.
Advice
• Read each question carefully before you start to answer it.
•• Check answer
Try to
your
every question.
answers if youabout
haveantime at the cross
end. it out and put your new answer
If you change your mind answer,
and any working underneath. Turn over
P76383A
©2025 Pearson Education Ltd.
Y:1/1/1/1/1/
,DO NOT WRITE IN THIS AREA DO NOT WRITE IN THIS AREA
■■■■
BLANK PAGE
2
, Answer ALL questions. Write your answers in the spaces provided.
1 A study in 2021 investigated the number of hail days in a large European area covering
DO NOT WRITE IN THIS AREA
Germany, France, Belgium and Luxembourg.
A hail day was defined as one in which a radar detected the conditions necessary for
hail to occur anywhere within this area. Over the past 20 years, the mean number of
hail days in a year in this area was 86
[Source : www.doi.org/10.5194/nhess‑21‑683‑2021]
(a) Find the probability that
(i) in a randomly chosen year there would be at least 90 hail days,
(2)
(ii) in a randomly chosen two‑year period, there are no more than 160 hail days.
DO NOT WRITE IN THIS AREA
(2)
(b) State two assumptions needed, in the context of this question, to calculate the
probabilities in (a) and in each case give a reason why that assumption may not
be appropriate.
(4)
DO NOT WRITE IN THIS AREA
(Total for Question 1 is 8 marks)
3
■■■■ Turn over
, 2 A small company based in the tourism industry is trying to decide where best to spend
its advertising budget in order to attract more visitors.
DO NOT WRITE IN THIS AREA
It is comparing the visitor numbers to mainland UK from France and from Ireland in
different periods of time.
Figure 1 shows the number of visitors from France and from Ireland for a randomly
selected series of yearly quarters. Visitor numbers have been rounded to the
nearest 1000
Quarter
2019 Q2 2019 Q3 2021 Q1 2021 Q3 2022 Q1 2022 Q3 2022 Q4
France 929 000 898 000 13 000 148 000 462 000 697 000 842 000
Country
Ireland 718 000 716 000 24 000 247 000 417 000 640 000 731 000
Figure 1
[Source : www.ons.gov.uk/peoplepopulationandcommunity/leisureandtourism]
DO NOT WRITE IN THIS AREA
In some quarters, the number of visitors from France exceeds that from Ireland, whilst
in others the reverse is true. The data is also clearly impacted by changes in travel
patterns following the pandemic.
You should assume that the difference between the numbers of visitors from France and
Ireland is not symmetrically distributed.
(a) Carry out a suitable hypothesis test to determine whether there is a difference
between the average number of visitors to mainland UK from the two countries.
(6)
DO NOT WRITE IN THIS AREA
4
■■■■