ALL 16 CHAPTERS COVERED
SOLUTIONS MANUAL
, CONTENTS
Chapter 1 Overview and Descriptive Statistics 1
Chapter 2 Probability 48
Chapter 3 Discrete Random Variables and Probability 90
Distributions
Chapter 4 Continuous Random Variables and Probability 126
Distributions
Chapter 5 Joint Probability Distributions and Random Samples 177
Chapter 6 Point Estimation 206
Chapter 7 Statistical Intervals Based on a Single Sample 217
Chapter 8 Tests of Hypotheses Based on a Single Sample 234
Chapter 9 Inferences Based on Two Samples 255
Chapter 10 The Analysis of Variance 285
Chapter 11 Multifactor Analysis of Variance 299
Chapter 12 Simple Linear Regression and Correlation 330
Chapter 13 Nonlinear and Multiple Regression 368
Chapter 14 Goodness-of-Fit Tests and Categorical Data Analysis 406
Chapter 15 Distribution-Free Procedures 424
Chapter 16 Quality Control Methods 434
, CHAPTER 1
Section 1.1
1.
a. Los Angeles Times, Oberlin Tribune, Gainesville Sun, Washington Post
b. Duke Energy, Clorox, Seagate, Neiman Marcus
c. Vince Correa, Catherine Miller, Michael Cutler, Ken Lee
d. 2.97, 3.56, 2.20, 2.97
2.
a. 29.1 yd, 28.3 yd, 24.7 yd, 31.0 yd
b. 432 pp, 196 pp, 184 pp, 321 pp
c. 2.1, 4.0, 3.2, 6.3
d. 0.07 g, 1.58 g, 7.1 g, 27.2 g
3.
a. How likely is it that more than half of the sampled computers will need or have needed
warranty service? What is the expected number among the 100 that need warranty
service? How likely is it that the number needing warranty service will exceed the
expected number by more than 10?
b. Suppose that 15 of the 100 sampled needed warranty service. How confident can we be
that the proportion of all such computers needing warranty service is between .08 and
.22? Does the sample provide compelling evidence for concluding that more than 10% of
all such computers need warranty service?
1
, Chapter 1: Overview and Descriptive Statistics
4.
a. Concrete populations: all living U.S. Citizens, all mutual funds marketed in the U.S., all
books published in 1980
Hypothetical populations: all grade point averages for University of California
undergraduates during the next academic year, page lengths for all books published
during the next calendar year, batting averages for all major league players during the
next baseball season
b. (Concrete) Probability: In a sample of 5 mutual funds, what is the chance that all 5 have
rates of return which exceeded 10% last year?
Statistics: If previous year rates-of-return for 5 mutual funds were 9.6, 14.5, 8.3, 9.9 and
10.2, can we conclude that the average rate for all funds was below 10%?
(Hypothetical) Probability: In a sample of 10 books to be published next year, how likely
is it that the average number of pages for the 10 is between 200 and 250?
Statistics: If the sample average number of pages for 10 books is 227, can we be highly
confident that the average for all books is between 200 and 245?
5.
a. No. All students taking a large statistics course who participate in an SI program of this
sort.
b. The advantage to randomly allocating students to the two groups is that the two groups
should then be fairly comparable before the study. If the two groups perform differently
in the class, we might attribute this to the treatments (SI and control). If it were left to
students to choose, stronger or more dedicated students might gravitate toward SI,
confounding the results.
c. If all students were put in the treatment group, there would be no firm basis for assessing
the effectiveness of SI (nothing to which the SI scores could reasonably be compared).
6. One could take a simple random sample of students from all students in the California State
University system and ask each student in the sample to report the distance form their
hometown to campus. Alternatively, the sample could be generated by taking a stratified
random sample by taking a simple random sample from each of the 23 campuses and again
asking each student in the sample to report the distance from their hometown to campus.
Certain problems might arise with self reporting of distances, such as recording error or poor
recall. This study is enumerative because there exists a finite, identifiable population of
objects from which to sample.
7. One could generate a simple random sample of all single-family homes in the city, or a
stratified random sample by taking a simple random sample from each of the 10 district
neighborhoods. From each of the selected homes, values of all desired variables would be
determined. This would be an enumerative study because there exists a finite, identifiable
population of objects from which to sample.
2
, Chapter 1: Overview and Descriptive Statistics
8.
a. Number observations equal 2 x 2 x 2 = 8
b. This could be called an analytic study because the data would be collected on an existing
process. There is no sampling frame.
9.
a. There could be several explanations for the variability of the measurements. Among
them could be measurement error (due to mechanical or technical changes across
measurements), recording error, differences in weather conditions at time of
measurements, etc.
b. No, because there is no sampling frame.
Section 1.2
10.
a.
59
6 33588
7 00234677889
8 127
9 077 stem: ones
10 7 leaf: tenths
11 368
A representative strength for these beams is around 7.8 MPa, but there is a reasonably
large amount of variation around that representative value.
(What constitutes large or small variation usually depends on context, but variation is
usually considered large when the range of the data – the difference between the largest
and smallest value – is comparable to a representative value. Here, the range is 11.8 – 5.9
= 5.9 MPa, which is similar in size to the representative value of 7.8 MPa. So, most
researchers would call this a large amount of variation.)
b. The data display is not perfectly symmetric around some middle/representative value.
There is some positive skewness in this data.
c. Outliers are data points that appear to be very different from the pack. Looking at the
stem-and-leaf display in part (a), there appear to be no outliers in this data. (A later
section gives a more precise definition of what constitutes an outlier.)
d. From the stem-and-leaf display in part (a), there are 4 values greater than 10. Therefore,
the proportion of data values that exceed 10 is 4/27 = .148, or, about 15%.
3
, Chapter 1: Overview and Descriptive Statistics
11.
3L 1
3H 56678
4L 000112222234
4H 5667888 stem: tenths
5L 144 leaf : hundredths
5H 58
6L 2
6H 6678
7L
7H 5
The stem-and-leaf display shows that .45 is a good representative value for the data. In
addition, the display is not symmetric and appears to be positively skewed. The range of the
data is .75 – .31 = .44, which is comparable to the typical value of .45. This constitutes a
reasonably large amount of variation in the data. The data value .75 is a possible outlier.
12. The sample size for this data set is n = 5 + 15 + 27 + 34 + 22 + 14 + 7 + 2 + 4 + 1 = 131.
a. The first four intervals correspond to observations less than 5, so the proportion of values
less than 5 is (5 + 15 + 27 + 34)/131 = 81/131 = .618.
b. The last four intervals correspond to observations at least 6, so the proportion of values at
least 6 is (7 + 2 + 4 + 1)/131 = 14/131 = .107.
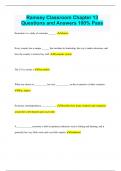
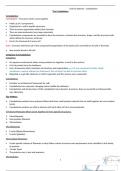
c. & d. The relative (percent) frequency and density histograms appear below. The
distribution of CeO2 sizes is not symmetric, but rather positively skewed. Notice that the
relative frequency and density histograms are essentially identical, other than the vertical
axis labeling, because the bin widths are all the same.
25 0.5
20 0.4
Percent
Density
15 0.3
10 0.2
5 0.1
0 0.0
3 4 5 6 7 8 3 4 5 6 7 8
CeO2 particle size (nm) CeO2 particle size (nm)
4
, Chapter 1: Overview and Descriptive Statistics
13.
a.
12 2 stem: tens
12 445 leaf: ones
12 6667777
12 889999
13 00011111111
13 2222222222333333333333333
13 44444444444444444455555555555555555555
13 6666666666667777777777
13 888888888888999999
14 0000001111
14 2333333
14 444
14 77
The observations are highly concentrated at around 134 or 135, where the display
suggests the typical value falls.
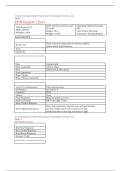
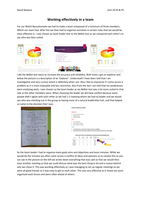
b.
40
30
Frequency
20
10
0
124 128 132 136 140 144 148
strength (ksi)
The histogram of ultimate strengths is symmetric and unimodal, with the point of
symmetry at approximately 135 ksi. There is a moderate amount of variation, and there
are no gaps or outliers in the distribution.
5
, Chapter 1: Overview and Descriptive Statistics
14.
a.
2 23 stem: 1.0
3 2344567789 leaf: .10
4 01356889
5 00001114455666789
6 0000122223344456667789999
7 00012233455555668
8 02233448
9 012233335666788
10 2344455688
11 2335999
12 37
13 8
14 36
15 0035
16
17
18 9
b. A representative is around 7.0.
c. The data exhibit a moderate amount of variation (this is subjective).
d. No, the data is skewed to the right, or positively skewed.
e. The value 18.9 appears to be an outlier, being more than two stem units from the previous
value.
15.
American French
8 1
755543211000 9 00234566
9432 10 2356
6630 11 1369
850 12 223558
8 13 7
14
15 8
2 16
American movie times are unimodal strongly positively skewed, while French movie times
appear to be bimodal. A typical American movie runs about 95 minutes, while French movies
are typically either around 95 minutes or around 125 minutes. American movies are generally
shorter than French movies and are less variable in length. Finally, both American and French
movies occasionally run very long (outliers at 162 minutes and 158 minutes, respectively, in
the samples).
6
, Chapter 1: Overview and Descriptive Statistics
16.
a.
Beams Cylinders
9 5 8
88533 6 16
98877643200 7 012488
721 8 13359 stem: ones
770 9 278 leaf: tenths
7 10
863 11 2
12 6
13
14 1
The data appears to be slightly skewed to the right, or positively skewed. The value of
14.1 MPa appears to be an outlier. Three out of the twenty, or 15%, of the observations
exceed 10 MPa.
b. The majority of observations are between 5 and 9 MPa for both beams and cylinders,
with the modal class being 7.0-7.9 MPa. The observations for cylinders are more
variable, or spread out, and the maximum value of the cylinder observations is higher.
c.
. . . :.. : .: . . . : . . .
-+---------+---------+---------+---------+---------+-----
6.0 7.5 9.0 10.5 12.0 13.5
Cylinder strength (MPa)
17. The sample size for this data set is n = 7 + 20 + 26 + … + 3 + 2 = 108.
a. “At most five bidders” means 2, 3, 4, or 5 bidders. The proportion of contracts that
involved at most 5 bidders is (7 + 20 + 26 + 16)/108 = 69/108 = .639.
Similarly, the proportion of contracts that involved at least 5 bidders (5 through 11) is
equal to (16 + 11 + 9 + 6 + 8 + 3 + 2)/108 = 55/108 = .509.
b. The number of contracts with between 5 and 10 bidders, inclusive, is 16 + 11 + 9 + 6 + 8
+ 3 = 53, so the proportion is 53/108 = .491. “Strictly” between 5 and 10 means 6, 7, 8, or
9 bidders, for a proportion equal to (11 + 9 + 6 + 8)/108 = 34/108 = .315.
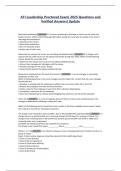
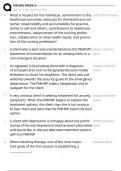
c. The distribution of number of bidders is positively skewed, ranging from 2 to 11 bidders,
with a typical value of around 4-5 bidders.
25
20
Frequency
15
10
5
0
2 3 4 5 6 7 8 9 10 11
Number of bidders
7
, Chapter 1: Overview and Descriptive Statistics
18.
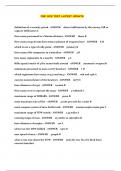
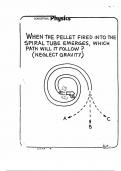
a. The most interesting feature of the histogram is the heavy presence of three very large
outliers (21, 24, and 32 directors). Absent these three corporations, the distribution of
number of directors would be roughly symmetric with a typical value of around 9.
20
15
Percent
10
5
0
4 8 12 16 20 24 28 32
Number of directors
Note: One way to have Minitab automatically construct a histogram from grouped data
such as this is to use Minitab’s ability to enter multiple copies of the same number by
typing, for example, 42(9) to enter 42 copies of the number 9. The frequency data in this
exercise was entered using the following Minitab commands:
MTB > set c1
DATA> 3(4) 12(5) 13(6) 25(7) 24(8) 42(9) 23(10) 19(11) 16(12)
11(13) 5(14) 4(15) 1(16) 3(17) 1(21) 1(24) 1(32)
DATA> end
b. The accompanying frequency distribution is nearly identical to the one in the textbook,
except that the three largest values are compacted into the “≥ 18” category. If this were
the originally-presented information, we could not create a histogram, because we would
not know the upper boundary for the rectangle corresponding to the “≥ 18” category.
No. dir. 4 5 6 7 8 9 10 11
Freq. 3 12 13 25 24 42 23 19
No dir. 12 13 14 15 16 17 ≥ 18
Freq. 16 11 5 4 1 3 3
c. The sample size is 3 + 12 + … + 3 + 1 + 1 + 1 = 204. So, the proportion of these
corporations that have at most 10 directors is (3 + 12 + 13 + 25 + 24 + 42 + 23)/204 =
142/204 = .696.
d. Similarly, the proportion of these corporations with more than 15 directors is (1 + 3 + 1 +
1 + 1)/204 = 7/204 = .034.
8
SOLUTIONS MANUAL
, CONTENTS
Chapter 1 Overview and Descriptive Statistics 1
Chapter 2 Probability 48
Chapter 3 Discrete Random Variables and Probability 90
Distributions
Chapter 4 Continuous Random Variables and Probability 126
Distributions
Chapter 5 Joint Probability Distributions and Random Samples 177
Chapter 6 Point Estimation 206
Chapter 7 Statistical Intervals Based on a Single Sample 217
Chapter 8 Tests of Hypotheses Based on a Single Sample 234
Chapter 9 Inferences Based on Two Samples 255
Chapter 10 The Analysis of Variance 285
Chapter 11 Multifactor Analysis of Variance 299
Chapter 12 Simple Linear Regression and Correlation 330
Chapter 13 Nonlinear and Multiple Regression 368
Chapter 14 Goodness-of-Fit Tests and Categorical Data Analysis 406
Chapter 15 Distribution-Free Procedures 424
Chapter 16 Quality Control Methods 434
, CHAPTER 1
Section 1.1
1.
a. Los Angeles Times, Oberlin Tribune, Gainesville Sun, Washington Post
b. Duke Energy, Clorox, Seagate, Neiman Marcus
c. Vince Correa, Catherine Miller, Michael Cutler, Ken Lee
d. 2.97, 3.56, 2.20, 2.97
2.
a. 29.1 yd, 28.3 yd, 24.7 yd, 31.0 yd
b. 432 pp, 196 pp, 184 pp, 321 pp
c. 2.1, 4.0, 3.2, 6.3
d. 0.07 g, 1.58 g, 7.1 g, 27.2 g
3.
a. How likely is it that more than half of the sampled computers will need or have needed
warranty service? What is the expected number among the 100 that need warranty
service? How likely is it that the number needing warranty service will exceed the
expected number by more than 10?
b. Suppose that 15 of the 100 sampled needed warranty service. How confident can we be
that the proportion of all such computers needing warranty service is between .08 and
.22? Does the sample provide compelling evidence for concluding that more than 10% of
all such computers need warranty service?
1
, Chapter 1: Overview and Descriptive Statistics
4.
a. Concrete populations: all living U.S. Citizens, all mutual funds marketed in the U.S., all
books published in 1980
Hypothetical populations: all grade point averages for University of California
undergraduates during the next academic year, page lengths for all books published
during the next calendar year, batting averages for all major league players during the
next baseball season
b. (Concrete) Probability: In a sample of 5 mutual funds, what is the chance that all 5 have
rates of return which exceeded 10% last year?
Statistics: If previous year rates-of-return for 5 mutual funds were 9.6, 14.5, 8.3, 9.9 and
10.2, can we conclude that the average rate for all funds was below 10%?
(Hypothetical) Probability: In a sample of 10 books to be published next year, how likely
is it that the average number of pages for the 10 is between 200 and 250?
Statistics: If the sample average number of pages for 10 books is 227, can we be highly
confident that the average for all books is between 200 and 245?
5.
a. No. All students taking a large statistics course who participate in an SI program of this
sort.
b. The advantage to randomly allocating students to the two groups is that the two groups
should then be fairly comparable before the study. If the two groups perform differently
in the class, we might attribute this to the treatments (SI and control). If it were left to
students to choose, stronger or more dedicated students might gravitate toward SI,
confounding the results.
c. If all students were put in the treatment group, there would be no firm basis for assessing
the effectiveness of SI (nothing to which the SI scores could reasonably be compared).
6. One could take a simple random sample of students from all students in the California State
University system and ask each student in the sample to report the distance form their
hometown to campus. Alternatively, the sample could be generated by taking a stratified
random sample by taking a simple random sample from each of the 23 campuses and again
asking each student in the sample to report the distance from their hometown to campus.
Certain problems might arise with self reporting of distances, such as recording error or poor
recall. This study is enumerative because there exists a finite, identifiable population of
objects from which to sample.
7. One could generate a simple random sample of all single-family homes in the city, or a
stratified random sample by taking a simple random sample from each of the 10 district
neighborhoods. From each of the selected homes, values of all desired variables would be
determined. This would be an enumerative study because there exists a finite, identifiable
population of objects from which to sample.
2
, Chapter 1: Overview and Descriptive Statistics
8.
a. Number observations equal 2 x 2 x 2 = 8
b. This could be called an analytic study because the data would be collected on an existing
process. There is no sampling frame.
9.
a. There could be several explanations for the variability of the measurements. Among
them could be measurement error (due to mechanical or technical changes across
measurements), recording error, differences in weather conditions at time of
measurements, etc.
b. No, because there is no sampling frame.
Section 1.2
10.
a.
59
6 33588
7 00234677889
8 127
9 077 stem: ones
10 7 leaf: tenths
11 368
A representative strength for these beams is around 7.8 MPa, but there is a reasonably
large amount of variation around that representative value.
(What constitutes large or small variation usually depends on context, but variation is
usually considered large when the range of the data – the difference between the largest
and smallest value – is comparable to a representative value. Here, the range is 11.8 – 5.9
= 5.9 MPa, which is similar in size to the representative value of 7.8 MPa. So, most
researchers would call this a large amount of variation.)
b. The data display is not perfectly symmetric around some middle/representative value.
There is some positive skewness in this data.
c. Outliers are data points that appear to be very different from the pack. Looking at the
stem-and-leaf display in part (a), there appear to be no outliers in this data. (A later
section gives a more precise definition of what constitutes an outlier.)
d. From the stem-and-leaf display in part (a), there are 4 values greater than 10. Therefore,
the proportion of data values that exceed 10 is 4/27 = .148, or, about 15%.
3
, Chapter 1: Overview and Descriptive Statistics
11.
3L 1
3H 56678
4L 000112222234
4H 5667888 stem: tenths
5L 144 leaf : hundredths
5H 58
6L 2
6H 6678
7L
7H 5
The stem-and-leaf display shows that .45 is a good representative value for the data. In
addition, the display is not symmetric and appears to be positively skewed. The range of the
data is .75 – .31 = .44, which is comparable to the typical value of .45. This constitutes a
reasonably large amount of variation in the data. The data value .75 is a possible outlier.
12. The sample size for this data set is n = 5 + 15 + 27 + 34 + 22 + 14 + 7 + 2 + 4 + 1 = 131.
a. The first four intervals correspond to observations less than 5, so the proportion of values
less than 5 is (5 + 15 + 27 + 34)/131 = 81/131 = .618.
b. The last four intervals correspond to observations at least 6, so the proportion of values at
least 6 is (7 + 2 + 4 + 1)/131 = 14/131 = .107.
c. & d. The relative (percent) frequency and density histograms appear below. The
distribution of CeO2 sizes is not symmetric, but rather positively skewed. Notice that the
relative frequency and density histograms are essentially identical, other than the vertical
axis labeling, because the bin widths are all the same.
25 0.5
20 0.4
Percent
Density
15 0.3
10 0.2
5 0.1
0 0.0
3 4 5 6 7 8 3 4 5 6 7 8
CeO2 particle size (nm) CeO2 particle size (nm)
4
, Chapter 1: Overview and Descriptive Statistics
13.
a.
12 2 stem: tens
12 445 leaf: ones
12 6667777
12 889999
13 00011111111
13 2222222222333333333333333
13 44444444444444444455555555555555555555
13 6666666666667777777777
13 888888888888999999
14 0000001111
14 2333333
14 444
14 77
The observations are highly concentrated at around 134 or 135, where the display
suggests the typical value falls.
b.
40
30
Frequency
20
10
0
124 128 132 136 140 144 148
strength (ksi)
The histogram of ultimate strengths is symmetric and unimodal, with the point of
symmetry at approximately 135 ksi. There is a moderate amount of variation, and there
are no gaps or outliers in the distribution.
5
, Chapter 1: Overview and Descriptive Statistics
14.
a.
2 23 stem: 1.0
3 2344567789 leaf: .10
4 01356889
5 00001114455666789
6 0000122223344456667789999
7 00012233455555668
8 02233448
9 012233335666788
10 2344455688
11 2335999
12 37
13 8
14 36
15 0035
16
17
18 9
b. A representative is around 7.0.
c. The data exhibit a moderate amount of variation (this is subjective).
d. No, the data is skewed to the right, or positively skewed.
e. The value 18.9 appears to be an outlier, being more than two stem units from the previous
value.
15.
American French
8 1
755543211000 9 00234566
9432 10 2356
6630 11 1369
850 12 223558
8 13 7
14
15 8
2 16
American movie times are unimodal strongly positively skewed, while French movie times
appear to be bimodal. A typical American movie runs about 95 minutes, while French movies
are typically either around 95 minutes or around 125 minutes. American movies are generally
shorter than French movies and are less variable in length. Finally, both American and French
movies occasionally run very long (outliers at 162 minutes and 158 minutes, respectively, in
the samples).
6
, Chapter 1: Overview and Descriptive Statistics
16.
a.
Beams Cylinders
9 5 8
88533 6 16
98877643200 7 012488
721 8 13359 stem: ones
770 9 278 leaf: tenths
7 10
863 11 2
12 6
13
14 1
The data appears to be slightly skewed to the right, or positively skewed. The value of
14.1 MPa appears to be an outlier. Three out of the twenty, or 15%, of the observations
exceed 10 MPa.
b. The majority of observations are between 5 and 9 MPa for both beams and cylinders,
with the modal class being 7.0-7.9 MPa. The observations for cylinders are more
variable, or spread out, and the maximum value of the cylinder observations is higher.
c.
. . . :.. : .: . . . : . . .
-+---------+---------+---------+---------+---------+-----
6.0 7.5 9.0 10.5 12.0 13.5
Cylinder strength (MPa)
17. The sample size for this data set is n = 7 + 20 + 26 + … + 3 + 2 = 108.
a. “At most five bidders” means 2, 3, 4, or 5 bidders. The proportion of contracts that
involved at most 5 bidders is (7 + 20 + 26 + 16)/108 = 69/108 = .639.
Similarly, the proportion of contracts that involved at least 5 bidders (5 through 11) is
equal to (16 + 11 + 9 + 6 + 8 + 3 + 2)/108 = 55/108 = .509.
b. The number of contracts with between 5 and 10 bidders, inclusive, is 16 + 11 + 9 + 6 + 8
+ 3 = 53, so the proportion is 53/108 = .491. “Strictly” between 5 and 10 means 6, 7, 8, or
9 bidders, for a proportion equal to (11 + 9 + 6 + 8)/108 = 34/108 = .315.
c. The distribution of number of bidders is positively skewed, ranging from 2 to 11 bidders,
with a typical value of around 4-5 bidders.
25
20
Frequency
15
10
5
0
2 3 4 5 6 7 8 9 10 11
Number of bidders
7
, Chapter 1: Overview and Descriptive Statistics
18.
a. The most interesting feature of the histogram is the heavy presence of three very large
outliers (21, 24, and 32 directors). Absent these three corporations, the distribution of
number of directors would be roughly symmetric with a typical value of around 9.
20
15
Percent
10
5
0
4 8 12 16 20 24 28 32
Number of directors
Note: One way to have Minitab automatically construct a histogram from grouped data
such as this is to use Minitab’s ability to enter multiple copies of the same number by
typing, for example, 42(9) to enter 42 copies of the number 9. The frequency data in this
exercise was entered using the following Minitab commands:
MTB > set c1
DATA> 3(4) 12(5) 13(6) 25(7) 24(8) 42(9) 23(10) 19(11) 16(12)
11(13) 5(14) 4(15) 1(16) 3(17) 1(21) 1(24) 1(32)
DATA> end
b. The accompanying frequency distribution is nearly identical to the one in the textbook,
except that the three largest values are compacted into the “≥ 18” category. If this were
the originally-presented information, we could not create a histogram, because we would
not know the upper boundary for the rectangle corresponding to the “≥ 18” category.
No. dir. 4 5 6 7 8 9 10 11
Freq. 3 12 13 25 24 42 23 19
No dir. 12 13 14 15 16 17 ≥ 18
Freq. 16 11 5 4 1 3 3
c. The sample size is 3 + 12 + … + 3 + 1 + 1 + 1 = 204. So, the proportion of these
corporations that have at most 10 directors is (3 + 12 + 13 + 25 + 24 + 42 + 23)/204 =
142/204 = .696.
d. Similarly, the proportion of these corporations with more than 15 directors is (1 + 3 + 1 +
1 + 1)/204 = 7/204 = .034.
8