MATH 225N Week 6 Assignment: Understanding Confidence
Intervals – Excel
Calculate a Confidence Interval for a Proportion - Excel
Question
In a random sample of 350 attendees of a minor league baseball game, 184 said that they bought
food from the concession stand. Create a 95% confidence interval for the proportion of fans who
bought food from the concession stand. Use Excel to create the confidence interval, rounding to
four decimal places.
Yes that's right. Keep it up!
(0.4734, 0.5780)
Answer Explanation
Correct answers:
0.4734
0.5780
The confidence interval for the unknown population
proportion p is (p̂ −z⋆p̂ (1−p̂ )n‾‾‾‾‾‾‾‾‾√,p̂ −z⋆p̂ (1−p̂ )n‾‾‾‾‾‾‾‾‾√). The confidence interval can
be calculated using Excel.
1. Identify α. Click on cell A1 and enter =1−0.95 and press ENTER.
2. Thus, α=0.05. Enter the number of successes, x=184, and sample size, n=350, in the Excel
sheet in cells A2 and A3. To find the proportion of successes, p̂ , click on cell A4 and
enter =A2/A3 and press ENTER.
3. Thus, p̂ ≈0.5257. Use the NORM.S.INV function in Excel to find z⋆. Click on cell A5,
enter =NORM.S.INV(1−A1/2), and press ENTER.
4. The answer for z⋆, rounded to two decimal places, is z⋆≈1.96. To calculate the standard
error, p̂ (1−p̂ )n‾‾‾‾‾‾‾‾‾√, click on cell A6 and enter =SQRT(A4∗(1−A4)/A3) and press ENTER.
, 5. The answer for the standard error, rounded to four decimal places,
is p̂ (1−p̂ )n‾‾‾‾‾‾‾‾‾√≈0.0267. To calculate the margin of error, z⋆p̂ (1−p̂ )n‾‾‾‾‾‾‾‾‾√, click on cell
A7 and enter =A5*A6 and press ENTER.
6. The answer for the margin of error, rounded to four decimal places,
is z⋆p̂ (1−p̂ )n‾‾‾‾‾‾‾‾‾√≈0.0523. The confidence interval for the population proportion has a
lower limit of A4−A7=0.4734 and an upper limit of A4+A7=0.5780. Thus, the 95%confidence
interval for the population proportion of fans who bought food from the concession stand, based
on this sample, is approximately (0.4734, 0.5780).
Calculate a Confidence Interval for a Proportion - Excel
Question
Alison, the owner of a regional chain of pizza stores, is trying to decide whether to add calzones
to the menu. She conducts a survey of 700 people in the region and asks whether they would
order calzones if they were on the menu. 46 people responded “yes.” Create a 90% confidence
interval for the proportion of people in the region who would order calzones if they were on the
menu.Round your answer to four decimal places.
Correct! You nailed it.
(0.0503, 0.0811)
90% confidence interval is (0.0503, 0.0811)
Explanation:
Given that x = 46 and n = 700
Sample proprotion p^ = x/n = 46/700= 0.0657
we know that z critical for 90% level is 1.645
Confidence interval = p^±z∗((1−p^)∗p^
)/n =0.0657±1.645∗((1−0.0657)∗0.0657)/700 =0.0657±1.645∗0.009364 =(0.0503,0.0811)
Calculate a Confidence Interval for the Mean, population standard deviation known -
Excel
Question
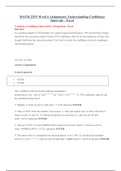
A company wants to determine a confidence interval for the average CPU time of its
teleprocessing transactions. A sample of 70 random transactions in milliseconds is given below.
Assume that the transaction times follow a normal distribution with a standard deviation
of 600 milliseconds. Use Excel to determine a 98% confidence interval for the average CPU time
in milliseconds. Round your answers to the nearest integer and use ascending order.
Great work! That's correct.
Intervals – Excel
Calculate a Confidence Interval for a Proportion - Excel
Question
In a random sample of 350 attendees of a minor league baseball game, 184 said that they bought
food from the concession stand. Create a 95% confidence interval for the proportion of fans who
bought food from the concession stand. Use Excel to create the confidence interval, rounding to
four decimal places.
Yes that's right. Keep it up!
(0.4734, 0.5780)
Answer Explanation
Correct answers:
0.4734
0.5780
The confidence interval for the unknown population
proportion p is (p̂ −z⋆p̂ (1−p̂ )n‾‾‾‾‾‾‾‾‾√,p̂ −z⋆p̂ (1−p̂ )n‾‾‾‾‾‾‾‾‾√). The confidence interval can
be calculated using Excel.
1. Identify α. Click on cell A1 and enter =1−0.95 and press ENTER.
2. Thus, α=0.05. Enter the number of successes, x=184, and sample size, n=350, in the Excel
sheet in cells A2 and A3. To find the proportion of successes, p̂ , click on cell A4 and
enter =A2/A3 and press ENTER.
3. Thus, p̂ ≈0.5257. Use the NORM.S.INV function in Excel to find z⋆. Click on cell A5,
enter =NORM.S.INV(1−A1/2), and press ENTER.
4. The answer for z⋆, rounded to two decimal places, is z⋆≈1.96. To calculate the standard
error, p̂ (1−p̂ )n‾‾‾‾‾‾‾‾‾√, click on cell A6 and enter =SQRT(A4∗(1−A4)/A3) and press ENTER.
, 5. The answer for the standard error, rounded to four decimal places,
is p̂ (1−p̂ )n‾‾‾‾‾‾‾‾‾√≈0.0267. To calculate the margin of error, z⋆p̂ (1−p̂ )n‾‾‾‾‾‾‾‾‾√, click on cell
A7 and enter =A5*A6 and press ENTER.
6. The answer for the margin of error, rounded to four decimal places,
is z⋆p̂ (1−p̂ )n‾‾‾‾‾‾‾‾‾√≈0.0523. The confidence interval for the population proportion has a
lower limit of A4−A7=0.4734 and an upper limit of A4+A7=0.5780. Thus, the 95%confidence
interval for the population proportion of fans who bought food from the concession stand, based
on this sample, is approximately (0.4734, 0.5780).
Calculate a Confidence Interval for a Proportion - Excel
Question
Alison, the owner of a regional chain of pizza stores, is trying to decide whether to add calzones
to the menu. She conducts a survey of 700 people in the region and asks whether they would
order calzones if they were on the menu. 46 people responded “yes.” Create a 90% confidence
interval for the proportion of people in the region who would order calzones if they were on the
menu.Round your answer to four decimal places.
Correct! You nailed it.
(0.0503, 0.0811)
90% confidence interval is (0.0503, 0.0811)
Explanation:
Given that x = 46 and n = 700
Sample proprotion p^ = x/n = 46/700= 0.0657
we know that z critical for 90% level is 1.645
Confidence interval = p^±z∗((1−p^)∗p^
)/n =0.0657±1.645∗((1−0.0657)∗0.0657)/700 =0.0657±1.645∗0.009364 =(0.0503,0.0811)
Calculate a Confidence Interval for the Mean, population standard deviation known -
Excel
Question
A company wants to determine a confidence interval for the average CPU time of its
teleprocessing transactions. A sample of 70 random transactions in milliseconds is given below.
Assume that the transaction times follow a normal distribution with a standard deviation
of 600 milliseconds. Use Excel to determine a 98% confidence interval for the average CPU time
in milliseconds. Round your answers to the nearest integer and use ascending order.
Great work! That's correct.

