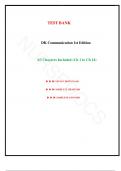
%Reads mapped to the reference cq9 A B
100 100.0
%Heterozygous SNPs
75
10.0
50
1.0
25
0 0.1
0 20 40 60 80 0.01 0.02 0.03 0.04
%Reads assigned to E. coli/Shigella by Kraken %Bases mapped that were mism
C D
1500
5000
4000
1000
Count
Count
3000
2000
500
1000
0 0
0 5 10 1 10 100 1000
Length (Mbp) Number of contigs
E
8000
Number of genes
6000
4000
4.0 4.5 5.0 5.5 6.0
Length (Mbp)
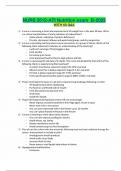
S1: Quality control measures used to filter genomes.A Percentage of
which were assigned to E. coli/Shigella using Kraken relative to the number of
mapped to an E. coli reference cq9. Red lines indicate cut-offs applied, top
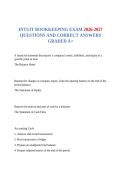
, A
Step 1: Pan-genome of each Step 2: Pairwise pan-genome
lineage analyses
All CDSs Gene groups All CDSs Gene groups
1 1+2
Roary
Roary
2 1+3
Roary Roary
3 2+3
Roary Roary
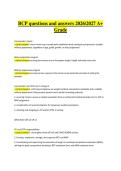
S2: Method for combining the pan-genome an
Step 3: Initiate combined graph Step 4: Map genes based on Clusters.A Procedure for a pan-genome analysis
using groups from from Step 1 results of Step 2
comparison. Step 1: a pan-genome analysis was
1+3
separately, generating gene clusters from all the CD
2+3 lineage. Step 2: A pan-genome analysis using Roary wa
1+2 a pairwise manner, generating new gene clusters. Step
1+2 where the gene clusters from Step 1 are the nodes. Ste
1+3
gene clusters was added if the members of both ge
2+3 2+3
1+3 2+3 together in the pairwise pan-genome analysis in Step 2
1+3
made to the graph using density based clustering and se
Connected components were extracted as the final
*if fewer than 80% of members of a gene
group are together, mapping isn't added Example of density based clustering correction. The gr
combined Roary graph as presented at the end of Ste
Step 5: Correct graph Step 6: Final genes group from one lineage. The nodes are numbered by the
the clustering result of density based clustering. In
between the two groups is only supported by a spuriou
The edges between Lineage 6 and the rest of yello
produce two groups. C Example of alignment based c
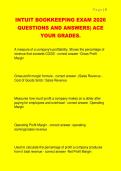
100 100.0
%Heterozygous SNPs
75
10.0
50
1.0
25
0 0.1
0 20 40 60 80 0.01 0.02 0.03 0.04
%Reads assigned to E. coli/Shigella by Kraken %Bases mapped that were mism
C D
1500
5000
4000
1000
Count
Count
3000
2000
500
1000
0 0
0 5 10 1 10 100 1000
Length (Mbp) Number of contigs
E
8000
Number of genes
6000
4000
4.0 4.5 5.0 5.5 6.0
Length (Mbp)
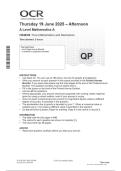
S1: Quality control measures used to filter genomes.A Percentage of
which were assigned to E. coli/Shigella using Kraken relative to the number of
mapped to an E. coli reference cq9. Red lines indicate cut-offs applied, top
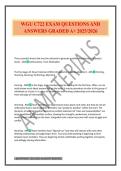
, A
Step 1: Pan-genome of each Step 2: Pairwise pan-genome
lineage analyses
All CDSs Gene groups All CDSs Gene groups
1 1+2
Roary
Roary
2 1+3
Roary Roary
3 2+3
Roary Roary
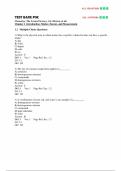
S2: Method for combining the pan-genome an
Step 3: Initiate combined graph Step 4: Map genes based on Clusters.A Procedure for a pan-genome analysis
using groups from from Step 1 results of Step 2
comparison. Step 1: a pan-genome analysis was
1+3
separately, generating gene clusters from all the CD
2+3 lineage. Step 2: A pan-genome analysis using Roary wa
1+2 a pairwise manner, generating new gene clusters. Step
1+2 where the gene clusters from Step 1 are the nodes. Ste
1+3
gene clusters was added if the members of both ge
2+3 2+3
1+3 2+3 together in the pairwise pan-genome analysis in Step 2
1+3
made to the graph using density based clustering and se
Connected components were extracted as the final
*if fewer than 80% of members of a gene
group are together, mapping isn't added Example of density based clustering correction. The gr
combined Roary graph as presented at the end of Ste
Step 5: Correct graph Step 6: Final genes group from one lineage. The nodes are numbered by the
the clustering result of density based clustering. In
between the two groups is only supported by a spuriou
The edges between Lineage 6 and the rest of yello
produce two groups. C Example of alignment based c