Jess Rolfe
stats & data science 188
S2 summaries 2024
chapter 7
sampling distributions
sampling distributions
what is a sampling distribution ?
• A sampling distribution is a distribution of all the possible values of a sample statistic for
a given sample size selected from a population
For example
Suppose you sample 50 students from university regarding their mean GPA. If you obtained
many different samples of size 50 , you will compute a different mean for each sample.
We are interested in the distribution of all potential means GPAs we might calculate for
samples of 50 students.
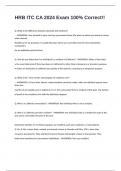
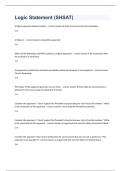
Sampling distributions
Sampling Sampling
distributions of the distributions of the
mean proportion
developing a sampling distribution
• A sampling distribution is the distribution of the results that would occur had one
selected all possible samples.
• In practice , one selects a single random sample of a predetermined size from the
population. The single result obtained is just one of the results in the sampling
distribution.
1. sampling distribution of the mean
• The sampling distribution of the mean is the distribution of all possible sample means
calculated from all possible samples of a given size.
The unbiased property of the sample mean
• The sample mean is unbiased because the mean of all the possible sample means (of
a given sample size, n) is equal to the population mean , µ.
1
,standard error of the mean (SE)
• Different samples of the same size from the same population will yield different sample
means
• A measure of the variability in the mean from sample to sample is given by the
standard error of the mean :
(this assumes that sampling is with replacement or sampling is without replacement from
an infinite population)
note : the standard error of the mean decreases ↓ as the sample size increases ↑
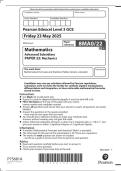
If the population is normal / normally distributed
• If the population is normal with mean µ and standard deviation σ , the sampling
distribution of x-bar is also normally distributed with :
then use the Z-value for sampling distribution of the mean (x-bar) :
sampling distribution properties :
2
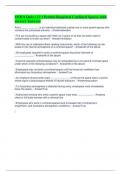
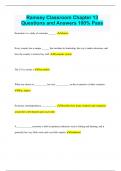
,Determine an interval including a fixed proportion of the sample means
• Sometimes one needs to find the interval that contains a specific proportion of the
sample means. To do so , determine a distance below and above the population
mean containing a specific area of the normal curve.
we arrange the formula to find x-bar :
We can now determine the UPPER and LOWER limit for which we think x-bar will fall
between. We do this by calculating X-bar lower and X-bar upper intervals.
e.g.
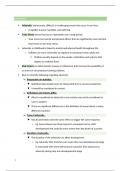
Sample mean sampling distribution : if the population is not normal
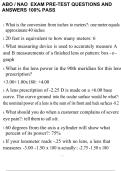
Central Limit Theorem :
• Even if the population is not normal
• … sample means from the population will be approximately normal as long as the
sample size is large enough
How large is large enough ?
- for most distributions , n > 30 will give a sampling distribution that is nearly normal
- For fairly symmetric distributions , n > 15 is large enough
- For a normal population distribution , the sampling distribution of the mean is always
normally distributed
3
, always remember :
3 steps
P → X → Z values
2. sampling distribution of the proportion
Population proportion
π = the proportion of the population having some characteristic
- sample proportion (p) provides an estimate of π
• 0 <= p <= 0
• X - binomial (n,π)
• p is approximately distributed as a normal distribution when n is large
(assuming sampling with replacement from a finite population or without replacement
from an infinite population)
sampling distribution of p
Approximated by a normal distribution if :
- nπ >= 5
- AND n(1-π) >= 5
where
µp = π
and
Z-value for proportions :
Standardise p to a Z-value with the formula
4
stats & data science 188
S2 summaries 2024
chapter 7
sampling distributions
sampling distributions
what is a sampling distribution ?
• A sampling distribution is a distribution of all the possible values of a sample statistic for
a given sample size selected from a population
For example
Suppose you sample 50 students from university regarding their mean GPA. If you obtained
many different samples of size 50 , you will compute a different mean for each sample.
We are interested in the distribution of all potential means GPAs we might calculate for
samples of 50 students.
Sampling distributions
Sampling Sampling
distributions of the distributions of the
mean proportion
developing a sampling distribution
• A sampling distribution is the distribution of the results that would occur had one
selected all possible samples.
• In practice , one selects a single random sample of a predetermined size from the
population. The single result obtained is just one of the results in the sampling
distribution.
1. sampling distribution of the mean
• The sampling distribution of the mean is the distribution of all possible sample means
calculated from all possible samples of a given size.
The unbiased property of the sample mean
• The sample mean is unbiased because the mean of all the possible sample means (of
a given sample size, n) is equal to the population mean , µ.
1
,standard error of the mean (SE)
• Different samples of the same size from the same population will yield different sample
means
• A measure of the variability in the mean from sample to sample is given by the
standard error of the mean :
(this assumes that sampling is with replacement or sampling is without replacement from
an infinite population)
note : the standard error of the mean decreases ↓ as the sample size increases ↑
If the population is normal / normally distributed
• If the population is normal with mean µ and standard deviation σ , the sampling
distribution of x-bar is also normally distributed with :
then use the Z-value for sampling distribution of the mean (x-bar) :
sampling distribution properties :
2
,Determine an interval including a fixed proportion of the sample means
• Sometimes one needs to find the interval that contains a specific proportion of the
sample means. To do so , determine a distance below and above the population
mean containing a specific area of the normal curve.
we arrange the formula to find x-bar :
We can now determine the UPPER and LOWER limit for which we think x-bar will fall
between. We do this by calculating X-bar lower and X-bar upper intervals.
e.g.
Sample mean sampling distribution : if the population is not normal
Central Limit Theorem :
• Even if the population is not normal
• … sample means from the population will be approximately normal as long as the
sample size is large enough
How large is large enough ?
- for most distributions , n > 30 will give a sampling distribution that is nearly normal
- For fairly symmetric distributions , n > 15 is large enough
- For a normal population distribution , the sampling distribution of the mean is always
normally distributed
3
, always remember :
3 steps
P → X → Z values
2. sampling distribution of the proportion
Population proportion
π = the proportion of the population having some characteristic
- sample proportion (p) provides an estimate of π
• 0 <= p <= 0
• X - binomial (n,π)
• p is approximately distributed as a normal distribution when n is large
(assuming sampling with replacement from a finite population or without replacement
from an infinite population)
sampling distribution of p
Approximated by a normal distribution if :
- nπ >= 5
- AND n(1-π) >= 5
where
µp = π
and
Z-value for proportions :
Standardise p to a Z-value with the formula
4