

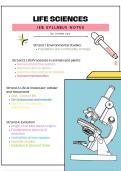
LIFE SCIENCES
IEB syllabus notes
by Jordan Law
Strand 1: Environmental Studies:
Population and community ecology
Strand 2: Life Processes in animals and plants:
Human endocrine system
Reproduction in plants
Reproductive animal strategies
Human reproduction
Strand 3: Life at molecular, cellular
and tissue level:
DNA - Code of life
Chromosomes and meiosis
Genetics and genetic
engineering
Strand 4: Evolution
Origin of an idea about origins
Fundamental aspects of
evolution
Formation of new species
Hominid studies
Evolution in present times
, life sciences
Practical Assessment
Task (PAT)
Common mistakes not to make:
Tables:
Forgetting to write a heading for the table.
Not using an appropriate preposition to indicate which variable is dependent in the table heading.
For example: table to show how the final colour of the solutions varies due to varying water
temperatures OR Table to show how the temperature of each solution affected the colour
intensity of the solution after 20 minutes of infusing the solution with beetroot.
Putting units in the body of the table. The unit goes ONLY in the column heading.
Variables:
Confusing variables: NB: the first column in a table usually contains the independent variable, and
the last column contains the dependent variable.
A lack of detail in answers, for example:
The temperature of the water
The beetroot length is measured to 10mm with a ruler and cut with a knife.
20 ml of water is added to each tube with a syringe.
Monitor water temperature with a thermometer.
Qualitative results are described, while quantitative results are measured (they have a unit)
Conclusion:
A conclusion must clearly state:
The relationship between the independent and dependent variable
Refer to the results.
E.g., as the temperature of the water was increased, the vacuoles of the beetroot cells became
more permeable, as seen by the darker intensity of red pigment in the solution.
Improving the design:
Repeating an experiment / collecting more data improves reliability.
Only if outliers are then eliminated from the data and an average calculated does this improve
accuracy.
Controlling an interfering variable better improves the validity of the experiment.
Measuring more precisely (bette technique or equipment) improves the accuracy of the results.
Never comment on what would be easier.
, life sciences
Practical Assessment
Task (PAT)
Graphs:
As per the tables, the graph heading must:
Contain the measured independent and dependent variables.
Express the relationship between the variables, E.g., a line graph showing the effect of different
concentrations of ethanol on the % transmission of light (for beetroot and red cabbage solutions)
OR A line graph showing the % transmission of light (for beetroot and red cabbage solutions) due
to the differing % ethanol in the solution.
When plotting a graph, the quantity measured (with unit) must be written on each axis.
Describe the trend in the results, e.g., as the % ethanol increases, the % transmission of light
decreases.
NB we can only say inversely proportional if the graph shape is a hyperbola OR directly proportional if
the graph is a straight line passing through the origin.
Dependent variable (y axis)
"Independent" means self-reliant, not
controlled by others, or not dependent
on other factors
"Dependent" means relying on another
for support, existence, or action
Independent variable (x axis)
Part B – experimental design
A hypothesis must be a specific prediction of the relationship between the independent and
dependent variables.
An aim must start with: To determine /investigate
An equipment list is NOT required for the method; writing one is a waste of time. Mention the
equipment and reagents as you use them in the method.
Remember details like quantities and the measuring equipment used.
If the independent variable is pH, then other variables that can affect permeability (like
temperature) must be controlled.
Never just say ‘record your/the results’ (e.g., record the intensity of the colour for each solution).
IEB syllabus notes
by Jordan Law
Strand 1: Environmental Studies:
Population and community ecology
Strand 2: Life Processes in animals and plants:
Human endocrine system
Reproduction in plants
Reproductive animal strategies
Human reproduction
Strand 3: Life at molecular, cellular
and tissue level:
DNA - Code of life
Chromosomes and meiosis
Genetics and genetic
engineering
Strand 4: Evolution
Origin of an idea about origins
Fundamental aspects of
evolution
Formation of new species
Hominid studies
Evolution in present times
, life sciences
Practical Assessment
Task (PAT)
Common mistakes not to make:
Tables:
Forgetting to write a heading for the table.
Not using an appropriate preposition to indicate which variable is dependent in the table heading.
For example: table to show how the final colour of the solutions varies due to varying water
temperatures OR Table to show how the temperature of each solution affected the colour
intensity of the solution after 20 minutes of infusing the solution with beetroot.
Putting units in the body of the table. The unit goes ONLY in the column heading.
Variables:
Confusing variables: NB: the first column in a table usually contains the independent variable, and
the last column contains the dependent variable.
A lack of detail in answers, for example:
The temperature of the water
The beetroot length is measured to 10mm with a ruler and cut with a knife.
20 ml of water is added to each tube with a syringe.
Monitor water temperature with a thermometer.
Qualitative results are described, while quantitative results are measured (they have a unit)
Conclusion:
A conclusion must clearly state:
The relationship between the independent and dependent variable
Refer to the results.
E.g., as the temperature of the water was increased, the vacuoles of the beetroot cells became
more permeable, as seen by the darker intensity of red pigment in the solution.
Improving the design:
Repeating an experiment / collecting more data improves reliability.
Only if outliers are then eliminated from the data and an average calculated does this improve
accuracy.
Controlling an interfering variable better improves the validity of the experiment.
Measuring more precisely (bette technique or equipment) improves the accuracy of the results.
Never comment on what would be easier.
, life sciences
Practical Assessment
Task (PAT)
Graphs:
As per the tables, the graph heading must:
Contain the measured independent and dependent variables.
Express the relationship between the variables, E.g., a line graph showing the effect of different
concentrations of ethanol on the % transmission of light (for beetroot and red cabbage solutions)
OR A line graph showing the % transmission of light (for beetroot and red cabbage solutions) due
to the differing % ethanol in the solution.
When plotting a graph, the quantity measured (with unit) must be written on each axis.
Describe the trend in the results, e.g., as the % ethanol increases, the % transmission of light
decreases.
NB we can only say inversely proportional if the graph shape is a hyperbola OR directly proportional if
the graph is a straight line passing through the origin.
Dependent variable (y axis)
"Independent" means self-reliant, not
controlled by others, or not dependent
on other factors
"Dependent" means relying on another
for support, existence, or action
Independent variable (x axis)
Part B – experimental design
A hypothesis must be a specific prediction of the relationship between the independent and
dependent variables.
An aim must start with: To determine /investigate
An equipment list is NOT required for the method; writing one is a waste of time. Mention the
equipment and reagents as you use them in the method.
Remember details like quantities and the measuring equipment used.
If the independent variable is pH, then other variables that can affect permeability (like
temperature) must be controlled.
Never just say ‘record your/the results’ (e.g., record the intensity of the colour for each solution).






