Statistics statistical tests
Spearman's rank correlation coefficient
- > the strength and direction of relationship between measurements of two
variables
● the value of rs is always between +1 and -1, whenthe rS value
exceed critical value then reject null hypothesis
● degree of freedom= number of data- 1
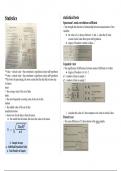
Unpaired t test
-> the significance of differences between means of different set of data
* *value > critical value = the correlation is significant, reject null hypothesis ● degree of freedom= n1+n2 - 2
**value < critical value = the correlation is significant, reject null hypothesis n1 = number of data in sample 1
**the lower the percentage, the more certain that the data did not arise due n2 = number of data in sample 2
to chance
mean
-> the average value of the set of data
mode
-> the most frequently occurring value in the set of data
median
-> the middle value of the set of data
standard deviation 1. calculate the value of t, then compare to the value to critical value
-> shows how far the data is from the mean
● the smaller the deviation, the closer the value to the mean
Paired t test
-> the mean difference of 2 observations in thesamesample
Spearman's rank correlation coefficient
- > the strength and direction of relationship between measurements of two
variables
● the value of rs is always between +1 and -1, whenthe rS value
exceed critical value then reject null hypothesis
● degree of freedom= number of data- 1
Unpaired t test
-> the significance of differences between means of different set of data
* *value > critical value = the correlation is significant, reject null hypothesis ● degree of freedom= n1+n2 - 2
**value < critical value = the correlation is significant, reject null hypothesis n1 = number of data in sample 1
**the lower the percentage, the more certain that the data did not arise due n2 = number of data in sample 2
to chance
mean
-> the average value of the set of data
mode
-> the most frequently occurring value in the set of data
median
-> the middle value of the set of data
standard deviation 1. calculate the value of t, then compare to the value to critical value
-> shows how far the data is from the mean
● the smaller the deviation, the closer the value to the mean
Paired t test
-> the mean difference of 2 observations in thesamesample