surname names
Number Number
Afternoon
Mathematics
■ ■
Advanced Subsidiary
PAPER 21: Statistics
Candidates may use any calculator allowed by Pearson regulations. Calculators must not have the facility
for symbolic algebra manipulation, differentiation and integration, or have retrievable mathematical formulae
stored in them.
Instructions
• If pencil is used for diagrams/sketches/graphs it must be dark (HB or B).
• Answer all questions and ensure that your answers to parts of questions are clearly labelled. – there may be more
space than you need.
You should show sufficient working to make your methods clear.
Answers without working may not gain full credit.
Values from statistical tables should be quoted in full. If a calculator is used instead of tables the value
should be given to an equivalent degree of accuracy.
Inexact answers should be given to three significant figures unless otherwise stated.
• The total mark for this part of the examination is 30. There are 5 questions. – use this as a guide
as to how much time to spend on each question.
Advice
Read each question carefully before you start to answer it.
• If you change your mind about an answer, cross it out and put your new answer and any
working underneath.
Check your answers if you have time at the end.
Turn over
, 1. A coach recorded the heights of some adult rugby players and found the following summary
statistics.
Median = 1.85 m
Range = 0.28 m Interquartile
range = 0.11 m
The coach also noticed that
• the height of the shortest player is 1.72 m
• 25% of the players‟ heights are below the height of a player whose height
is 1.81 m
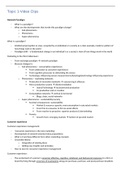
Draw a box and whisker plot to represent this information on the grid below.
(4)
1.60 1.70 1.80 1.90 2.00 2.10
Height (metres)
Use the spare grid on page 3 if you need to redraw your box and whisker plot.
2
■■■■
, Question 1 continued
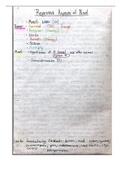
Only use this grid if you need to redraw your box and whisker plot.
1.60 1.70 1.80 1.90 2.00 2.10
Height (metres)
(Total for Question 1 is 4 marks)
3
■■■■ Turn over
Number Number
Afternoon
Mathematics
■ ■
Advanced Subsidiary
PAPER 21: Statistics
Candidates may use any calculator allowed by Pearson regulations. Calculators must not have the facility
for symbolic algebra manipulation, differentiation and integration, or have retrievable mathematical formulae
stored in them.
Instructions
• If pencil is used for diagrams/sketches/graphs it must be dark (HB or B).
• Answer all questions and ensure that your answers to parts of questions are clearly labelled. – there may be more
space than you need.
You should show sufficient working to make your methods clear.
Answers without working may not gain full credit.
Values from statistical tables should be quoted in full. If a calculator is used instead of tables the value
should be given to an equivalent degree of accuracy.
Inexact answers should be given to three significant figures unless otherwise stated.
• The total mark for this part of the examination is 30. There are 5 questions. – use this as a guide
as to how much time to spend on each question.
Advice
Read each question carefully before you start to answer it.
• If you change your mind about an answer, cross it out and put your new answer and any
working underneath.
Check your answers if you have time at the end.
Turn over
, 1. A coach recorded the heights of some adult rugby players and found the following summary
statistics.
Median = 1.85 m
Range = 0.28 m Interquartile
range = 0.11 m
The coach also noticed that
• the height of the shortest player is 1.72 m
• 25% of the players‟ heights are below the height of a player whose height
is 1.81 m
Draw a box and whisker plot to represent this information on the grid below.
(4)
1.60 1.70 1.80 1.90 2.00 2.10
Height (metres)
Use the spare grid on page 3 if you need to redraw your box and whisker plot.
2
■■■■
, Question 1 continued
Only use this grid if you need to redraw your box and whisker plot.
1.60 1.70 1.80 1.90 2.00 2.10
Height (metres)
(Total for Question 1 is 4 marks)
3
■■■■ Turn over