Technical Analysis for Trading
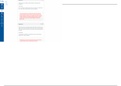
Introduction to Technical Analysis and Candlestick Charts
Technical analysis focuses on studying historical price movements to predict future market behavior.
It revolves around price action, using trends, support and resistance, and indicators derived from
price data. A candlestick chart is the core visual tool in technical analysis, showing price movement
over time through candlesticks that display highs, lows, open, and close prices.
Candlesticks help identify market trends. An uptrend is characterized by higher highs and higher
lows, and remains valid as long as the lowest point of a pullback is not broken. In contrast, a
downtrend features lower highs and lower lows, and the downtrend continues unless the previous
pullback's high is broken.
Support and Resistance
Support and resistance are key areas on a chart where price is likely to react. Support is where price
may bounce upward, and resistance is where it may fall. In bearish conditions, once price breaks
below support, that area can turn into resistance. These levels are useful for setting stop losses and
targets - placing stops below support and targets around previous highs or resistance zones.
Average True Range (ATR) Indicator
The ATR measures market volatility by showing the average price movement over the last 14
candles. It's useful for setting stop losses and targets: a stop is often placed one ATR beyond a