

Exam (elaborations)
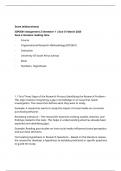
IOP2601 Assignment 2 Semester 1 | Due 31 March 2025
Save 4 minutes reading time
· Course
· Organisational Research Methodology (IOP2601)
· Institution
· University Of South Africa (Unisa)
· Book
· Numbers, Hypotheses
1.1 First Three Steps of the Research Process Identifying the Research Problem –
This step involves recognizing a gap in knowledge or an issue that needs
investigation. The researcher defines what they want to study.
Example: A researcher wants to study the impact of social media on consumer
purchasing behavior.
Reviewing Literature – The researcher examines existing studies, theories, and
findings related to the topic. This helps in understanding what has already been
explored and identifying gaps.
Example: Reading past studies on how social media influences brand perception
and purchase decisions.
Formulating Hypothesis or Research Questions – Based on the literature review,
the researcher develops a hypothesis (a testable prediction) or specific questions
to guide the study.
, Example: “Does Instagram advertising increase brand loyalty among young
adults?”
1.2 Difference Between Descriptive and Inferential Statistics Descriptive Statistics –
These summarize and present data in a meaningful way using measures such as
mean, median, mode, and standard deviation. They describe the main features of
a dataset without making conclusions beyond the given data.
Example: Calculating the average age of students in a classroom.
Inferential Statistics – These use data from a sample to make predictions or
generalizations about a larger population. Techniques include hypothesis testing,
regression analysis, and confidence intervals.
Example: Using a survey of 200 people to predict voting trends in a country.
Difference Between Descriptive and Inferential Statistics
1. Descriptive Statistics Descriptive statistics summarize and organize data in a
meaningful way without making predictions or generalizations. These
statistics help to describe patterns, trends, and relationships within a
dataset.
✅ Examples:
Measures of central tendency (Mean, Median, Mode)
Measures of dispersion (Range, Standard Deviation, Variance)
Visual representations (Graphs, Tables, Pie Charts)
🔹 Example: If a university surveys 100 students and finds that their average exam
score is 75%, this is a descriptive statistic because it only describes the observed
data.
2. Inferential Statistics Inferential statistics allow researchers to draw
conclusions, make predictions, or test hypotheses about a larger population
based on a sample. These statistics use probability theory and sampling
techniques to generalize findings.
✅ Examples:
Hypothesis testing (e.g., t-tests, chi-square tests)
Confidence intervals (estimating population parameters)
IOP2601 Assignment 2 Semester 1 | Due 31 March 2025
Save 4 minutes reading time
· Course
· Organisational Research Methodology (IOP2601)
· Institution
· University Of South Africa (Unisa)
· Book
· Numbers, Hypotheses
1.1 First Three Steps of the Research Process Identifying the Research Problem –
This step involves recognizing a gap in knowledge or an issue that needs
investigation. The researcher defines what they want to study.
Example: A researcher wants to study the impact of social media on consumer
purchasing behavior.
Reviewing Literature – The researcher examines existing studies, theories, and
findings related to the topic. This helps in understanding what has already been
explored and identifying gaps.
Example: Reading past studies on how social media influences brand perception
and purchase decisions.
Formulating Hypothesis or Research Questions – Based on the literature review,
the researcher develops a hypothesis (a testable prediction) or specific questions
to guide the study.
, Example: “Does Instagram advertising increase brand loyalty among young
adults?”
1.2 Difference Between Descriptive and Inferential Statistics Descriptive Statistics –
These summarize and present data in a meaningful way using measures such as
mean, median, mode, and standard deviation. They describe the main features of
a dataset without making conclusions beyond the given data.
Example: Calculating the average age of students in a classroom.
Inferential Statistics – These use data from a sample to make predictions or
generalizations about a larger population. Techniques include hypothesis testing,
regression analysis, and confidence intervals.
Example: Using a survey of 200 people to predict voting trends in a country.
Difference Between Descriptive and Inferential Statistics
1. Descriptive Statistics Descriptive statistics summarize and organize data in a
meaningful way without making predictions or generalizations. These
statistics help to describe patterns, trends, and relationships within a
dataset.
✅ Examples:
Measures of central tendency (Mean, Median, Mode)
Measures of dispersion (Range, Standard Deviation, Variance)
Visual representations (Graphs, Tables, Pie Charts)
🔹 Example: If a university surveys 100 students and finds that their average exam
score is 75%, this is a descriptive statistic because it only describes the observed
data.
2. Inferential Statistics Inferential statistics allow researchers to draw
conclusions, make predictions, or test hypotheses about a larger population
based on a sample. These statistics use probability theory and sampling
techniques to generalize findings.
✅ Examples:
Hypothesis testing (e.g., t-tests, chi-square tests)
Confidence intervals (estimating population parameters)


