Business Analytics Exam Preparation: Practice
Exam HBX Online Questions And
Answers|Latest Update
A restaurant supply manager analyzes the relationship between a restaurant's location and the
number of meals consumed by comparing clients in two locations: Munich and Paris. The
manager's first regression model uses the number of meals consumed as the dependent variable
and a dummy variable for location (Munich or Paris) as an independent variable. This model has
an R-squared of 0.712, and the coefficient for location is statistically significant.
The manager runs a second model, adding another variable, the amount of wine consumed with
meal. In this model, the coefficient for location is no longer significant, the R-squared has
increased from 0.712 to 0.719, and the adjusted R-squared has decreased. Which of the following
is the most likely reason for this pattern of changes?
a) The owner made a mistake; it is impossible for a once significant variable to no longer be
significant.
b) The variables for location an b) The variables for location and wine consumption are
collinear.
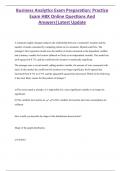
How would you describe the shape of the distribution shown below?
Shape of the graph distribution.
a) Uniform
, Business Analytics Exam Preparation: Practice
Exam HBX Online Questions And
Answers|Latest Update
b) Right-tailed
c) Left-tailed
d) Symmetric b) Right-tailed
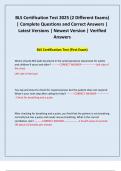
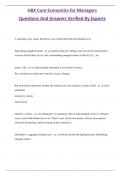
How many houses cost more than $200 thousand and less than or equal to $800 thousand?
Houses costing more than $200 thousand and less than or equal to $800 thousand.
a) Approximately 11
b) Approximately 15
c) Approximately 22
d) Approximately 25 c) Approximately 22
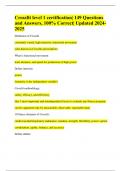
A manager examines the histogram below and, after conducting additional research, finds that
the observation in bin 3 is an input error and should have been entered as 13.
If the histogram is updated with the correct number, which of the following will occur?
a) The mean will decrease.
, Business Analytics Exam Preparation: Practice
Exam HBX Online Questions And
Answers|Latest Update
b) The mode will increase.
c) The median will increase.
d) The standard deviation will decrease. d) The standard deviation will decrease.
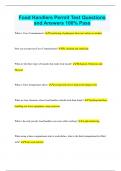
Which of the following Excel formulas or tools would correctly calculate the average hourly hot
dog sales over a two-day period from the data shown below? SELECT ALL THAT APPLY.
a) The Descriptive Statistics tool
b) AVERAGE(B2:B17)
c) AVERAGEIF(B2:B17)
d) MEAN(B2:B17)
e) MEDIAN(B2:B17)
f) MODE.SNGL(B2:B17)
g) SUM(B2:B17)/COUNT(B2:B17) a) The Descriptive Statistics tool
b) AVERAGE(B2:B17)
g) SUM(B2:B17)/COUNT(B2:B17)
If the variance of a data set is 486.75, what is the standard deviation?
Exam HBX Online Questions And
Answers|Latest Update
A restaurant supply manager analyzes the relationship between a restaurant's location and the
number of meals consumed by comparing clients in two locations: Munich and Paris. The
manager's first regression model uses the number of meals consumed as the dependent variable
and a dummy variable for location (Munich or Paris) as an independent variable. This model has
an R-squared of 0.712, and the coefficient for location is statistically significant.
The manager runs a second model, adding another variable, the amount of wine consumed with
meal. In this model, the coefficient for location is no longer significant, the R-squared has
increased from 0.712 to 0.719, and the adjusted R-squared has decreased. Which of the following
is the most likely reason for this pattern of changes?
a) The owner made a mistake; it is impossible for a once significant variable to no longer be
significant.
b) The variables for location an b) The variables for location and wine consumption are
collinear.
How would you describe the shape of the distribution shown below?
Shape of the graph distribution.
a) Uniform
, Business Analytics Exam Preparation: Practice
Exam HBX Online Questions And
Answers|Latest Update
b) Right-tailed
c) Left-tailed
d) Symmetric b) Right-tailed
How many houses cost more than $200 thousand and less than or equal to $800 thousand?
Houses costing more than $200 thousand and less than or equal to $800 thousand.
a) Approximately 11
b) Approximately 15
c) Approximately 22
d) Approximately 25 c) Approximately 22
A manager examines the histogram below and, after conducting additional research, finds that
the observation in bin 3 is an input error and should have been entered as 13.
If the histogram is updated with the correct number, which of the following will occur?
a) The mean will decrease.
, Business Analytics Exam Preparation: Practice
Exam HBX Online Questions And
Answers|Latest Update
b) The mode will increase.
c) The median will increase.
d) The standard deviation will decrease. d) The standard deviation will decrease.
Which of the following Excel formulas or tools would correctly calculate the average hourly hot
dog sales over a two-day period from the data shown below? SELECT ALL THAT APPLY.
a) The Descriptive Statistics tool
b) AVERAGE(B2:B17)
c) AVERAGEIF(B2:B17)
d) MEAN(B2:B17)
e) MEDIAN(B2:B17)
f) MODE.SNGL(B2:B17)
g) SUM(B2:B17)/COUNT(B2:B17) a) The Descriptive Statistics tool
b) AVERAGE(B2:B17)
g) SUM(B2:B17)/COUNT(B2:B17)
If the variance of a data set is 486.75, what is the standard deviation?