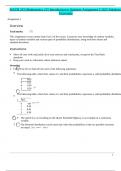
MATH 215| Mathematics 215 Introduction to Statistics Assignment 3 2025 Athabasca
University
Assignment 3
Overview
Total marks: / 75
This assignment covers content from Unit 3 of the course. It assesses your knowledge of random variables,
types of random variables and various types of probability distributions, along with their means and
standard deviations.
Instructions
Show all your work and justify all of your answers and conclusions, except for the True/False
questions.
Keep your work to 4 decimals, unless otherwise stated.
(4 marks)
F True (T) or False (F) for each of the following statements:
1. Circle
T The following table, which lists values of x and their probabilities, represents a valid probability distributio
x P(x)
3 0.32
4 0.54
5 0.24
F
The following table, which lists values of x and their probabilities, represents a valid probability distributio
T
x P(x)
0 .09
1 0.28
2 0.42
3 0.39
T F The speed of a car travelling on the Queen Elizabeth Highway is an example of a continuous
variable.
T F The binomial distribution can be used only when the probabilities of the two possible outcomes
are equal.
1
, (16 marks)
2. The following table lists the frequency distribution of the number of vehicles owned per household
from a sample of 200 households:
x 0 1 2 3 4 5
f 33 106 45 10 4 2
(4 marks)
a. Construct a probability distribution table for the number of vehicles owned per household.
(2 marks)
b. Calculate the mean of this probability distribution. Hint: Consider adding the appropriate column to
the table created in part (a).
2
University
Assignment 3
Overview
Total marks: / 75
This assignment covers content from Unit 3 of the course. It assesses your knowledge of random variables,
types of random variables and various types of probability distributions, along with their means and
standard deviations.
Instructions
Show all your work and justify all of your answers and conclusions, except for the True/False
questions.
Keep your work to 4 decimals, unless otherwise stated.
(4 marks)
F True (T) or False (F) for each of the following statements:
1. Circle
T The following table, which lists values of x and their probabilities, represents a valid probability distributio
x P(x)
3 0.32
4 0.54
5 0.24
F
The following table, which lists values of x and their probabilities, represents a valid probability distributio
T
x P(x)
0 .09
1 0.28
2 0.42
3 0.39
T F The speed of a car travelling on the Queen Elizabeth Highway is an example of a continuous
variable.
T F The binomial distribution can be used only when the probabilities of the two possible outcomes
are equal.
1
, (16 marks)
2. The following table lists the frequency distribution of the number of vehicles owned per household
from a sample of 200 households:
x 0 1 2 3 4 5
f 33 106 45 10 4 2
(4 marks)
a. Construct a probability distribution table for the number of vehicles owned per household.
(2 marks)
b. Calculate the mean of this probability distribution. Hint: Consider adding the appropriate column to
the table created in part (a).
2