tall
lab 3 : free
·
models for graphs ·
procedure lab 4
·
model used to compare (time , position) data points at constant acceleration obtain a conversion factor of aubins to meters
X =
Xo + Vot +
Gat 9 = 9 8 m/s
.
equation rewritten in y mx + b format
4 aub Is 2
·
=
9 best = 291 .
v =
Vo + at
9
.8 m Xaubins2914
abso n
you can use this equation when obtaining X (position) a + (time) data to plot .
S2
a velocity vs .
time graph
Vo = intercept 29
.7 3 0 aubins per meter
d =
slope
291 4 aubins
X meters.
a
a
.
.
·
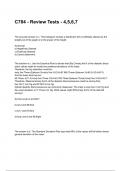
question 2 S2
·
graph for x vs .
t of a free falling object . .
0 034 meters per aubin
Xa A
as time
I ncreases the position ,
of the object relative to its
starting point increases
D
↳ the curve of the graph represents the
t
velocity of the object which is also increasing
as the object falls
velocity intercept : Initial position
Slope :
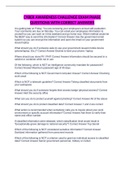
question 3
,
·
graph of v vs t
·
.
va
* Obtain velocity by v =
E
T
velocity increases as time increases due to gravity
↳ the line represents gravitational
acceleration which is constant
slope : gravity intercept : initial velocity
#
,
·
trendline equation
y = mx + b
X: independent variable
y : dependent variable
·
question 5
meaning of intercept a slope
. 3046 represents the acceleration in mis
?
m = 2
b = 3 3029 represents the initial velocity i n mis
.
* when an uncertainty is greater than the central value , It implies that the
quantity is consistent wi ze ro
eg : (0 .
07 = 0 .
09) mis
procedure
·
uncertainty in Av
v =
E
·
uncertainty of X = 0 .
05
· WemultipliedXb S s
? AV =
30AX +
1 x I . (0 05
30 .
+ 0 .
05) = 3
lab 3 : free
·
models for graphs ·
procedure lab 4
·
model used to compare (time , position) data points at constant acceleration obtain a conversion factor of aubins to meters
X =
Xo + Vot +
Gat 9 = 9 8 m/s
.
equation rewritten in y mx + b format
4 aub Is 2
·
=
9 best = 291 .
v =
Vo + at
9
.8 m Xaubins2914
abso n
you can use this equation when obtaining X (position) a + (time) data to plot .
S2
a velocity vs .
time graph
Vo = intercept 29
.7 3 0 aubins per meter
d =
slope
291 4 aubins
X meters.
a
a
.
.
·
question 2 S2
·
graph for x vs .
t of a free falling object . .
0 034 meters per aubin
Xa A
as time
I ncreases the position ,
of the object relative to its
starting point increases
D
↳ the curve of the graph represents the
t
velocity of the object which is also increasing
as the object falls
velocity intercept : Initial position
Slope :
question 3
,
·
graph of v vs t
·
.
va
* Obtain velocity by v =
E
T
velocity increases as time increases due to gravity
↳ the line represents gravitational
acceleration which is constant
slope : gravity intercept : initial velocity
#
,
·
trendline equation
y = mx + b
X: independent variable
y : dependent variable
·
question 5
meaning of intercept a slope
. 3046 represents the acceleration in mis
?
m = 2
b = 3 3029 represents the initial velocity i n mis
.
* when an uncertainty is greater than the central value , It implies that the
quantity is consistent wi ze ro
eg : (0 .
07 = 0 .
09) mis
procedure
·
uncertainty in Av
v =
E
·
uncertainty of X = 0 .
05
· WemultipliedXb S s
? AV =
30AX +
1 x I . (0 05
30 .
+ 0 .
05) = 3