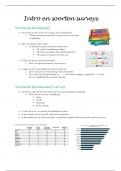
Summary Statistics part 1
R-helpdesk
Key concepts
Units: These are the individual items or subjects you're studying or
collecting data from
Student, city, or a product
Variables: Characteristics you can measure about each unit.
For a student (unit), variables could include age, GPA, or height.
Types of variables:
1. Numerical (quantitative): numerical values
Dichotomous: variables with only two possible categories
Scale variables:
o Continuous: infinite number of values within a given range,
can be measured and ordered
Ratio Variables: have a meaningful zero point, which
signifies the absence of the quantity. Ratios between
values are meaningful (e.g., weight, height, age).
Interval Variables: intervals between variables are
meaningful, but do not have a true zero point, so you can’t
make ratio comparisons. For example, temperature in
Celsius or Fahrenheit is interval because 0°C or 0°F does
not mean "no temperature."
o Discrete: specific set of numeric values that can be counted
or enumerated, often counted
Example: number of pets in a household
2. Categorical (qualitative): limited number of distinct categories.
Categories can be identified with numbers: Man=0, Female=1 (dummy
variables)
Ordinal (ranked): categories that have a meaningful order/ranking,
but the intervals between categories are not necessarily equal
o Unsatisfied, neutral, satisfied
, o High school, Bachelor, Master
Nominal: variable where categories have no natural order or
ranking.
o Women, man, others
o Eye color: blue, brown, green
Main descriptive statistics
Descriptive statistics give us basic information about the data.
Mean: the average of the values
Median: the middle value of a data set when all values are arranged in
ascending (or descending) order.
o If there's an odd number of values, the median is the center
value. If there's an even number of values, the median is the
average of the two middle values.
Standard deviation (SD): measures how spread out the values are
in the dataset.
o The square root of variance: sqrt(variance)
Variance: measures how much the values differ from the mean, on
average.
o Square of standard deviation: sd^2
Testing/Doing inference – General steps
Using a sample to draw a conclusion about a population
1. Define the Null-hypothesis
Null Hypothesis (H0): Represents no effect or no difference (e.g., no
relationship in linear regression, means are equal, or proportions are
the same).
Alternative Hypothesis (H1): Represents the effect, difference, or
relationship you are testing for.
a. H0: (coefficient) =0
b. H1 (coefficient in use) ≠ 0
2. Checking assumptions
a. Means
i. Normal distribution
ii. Outliers
iii. Number of samples
, b. Proportions
i. Big sample size
c. Chi-square
i. Expected cell frequencies
d. Linear Models
i. Linear relationship between variables
ii. Residuals are normally distributed
iii. Equal variance of residuals
3. Calculate test statistics
a. Means: t-test
b. Proportion: z-test
c. Linear models: regression coefficients
d. Difference between groups: t-test, Welch t-test, ANOVA, Welch
ANOVA
e. Quality of the model: f-test
4. Determine the distribution
5. Calculate confidence Interval
6. Interpret results
Confidence Interval:
o If 95% CI does NOT include 0 --> Reject null-hypothesis
o If 95% CI DOES include 0 --> Accept null-hypothesis
P-value (<0.05): significant, reject null hypothesis
Compare test-statistic with the critical value of the
distribution
o E.g. t-value > 2sd --> reject null-hypothesis
7. Draw a conclusion
a. Reject H0: Evidence supports the alternative hypothesis (H1)
b. Fail to Reject H0: No sufficient evidence to support H1.
Week 1: Proportions and Means
, Sampling distribution
Sampling distribution = repeatedly draw many samples from a population
and calculate statistic for each sample
For proportions: Mean: µ(p̂ ) and standard deviation: 𝝈(𝐩̂ )
For means: Mean: µ(𝒙̅) and standard deviation: 𝝈(𝒙̅)
Central Limit Theorem= if n becomes infinitely large, the sampling
distribution will become normal -> standard error decreases
P-value
Setting the significance level alpha (α)
alpha (α)= represents the probability of accepting a Type I error
Type I error/ α / false positive): rejecting the null hypothesis when
it's true
Type II error/ β/ false positive): not rejecting the null hypothesis
when it's false, the alternative hypothesis is true
Rule for hypothesis testing
If the p-value is less than α (e.g. p<0.05): Reject the null
hypothesis.
o Proportion: the sample proportion is likely different from the
population proportion
o Mean: the sample mean is likely different from the hypothesized
population mean