STA - CHAPTER 3 PART 1 (3.1-3.3)
QUESTIONS WITH CORRECT ANSWERS
The rrU.S. rrDepartment rrof rrHousing rrand rrUrban rrDevelopment rr(HUD) rruses rrthe
rrmedian rrto rrreport rrthe rraverage rrprice rrof rra rrhome rrin rrthe rrUnited rrStates. rrWhy rrdo
rryou rrthink rrHUD rruses rrthe rrmedian? rr- rrAnswer rrHUD rruses rrthe rrmedian rrbecause
rrthe rrdata rrare rrskewed rrright.
A rrhistogram rrof rra rrset rrof rrdata rrindicates rrthat rrthe rrdistribution rrof rrthe rrdata rris
rrskewed rrright. rrWhich rrmeasure rrof rrcentral rrtendency rrwill rrlikely rrbe rrlarger, rrthe
rrmean rror rrthe rrmedian? rrWhy? rr- rrAnswer rrThe rrmean rrwill rrlikely rrbe rrlarger rrbecause
rrthe rrextreme rrvalues rrin rrthe rrright rrtail rrtend rrto rrpull rrthe rrmean rrin rrthe rrdirection rrof
rrthe rrtail.
True rror rrFalse: rrA rrdata rrset rrwill rralways rrhave rrexactly rrone rrmode. rr- rrAnswer rrFalse
Find rrthe rrpopulation rrmean rror rrsample rrmean rras rrindicated.
Sample: rr19, rr10, rr1, rr9, rr16, rr- rrAnswer rrThe rrsample rrmean rris rr11.
The rrmedian rrfor rrthe rrgiven rrset rrof rrsix rrordered rrdata rrvalues rris rr29.5.
9 rr12 rr25 rr__ rr41 rr49
What rris rrthe rrmissing rrvalue? rr- rrAnswer rrThe rrmissing rrvalue rris rr34.
An rrinsurance rrcompany rrcrashed rrfour rrcars rrof rrthe rrsame rrmodel rrat rr5 rrmiles rrper
rrhour. rrThe rrcosts rrof rrrepair rrfor rreach rrof rrthe rrfour rrcrashes rrwere rr
$434, rr$401, rr$482, rrand rr$227 rr.
Compute rrthe rrmean, rrmedian, rrand rrmode rrcost rrof rrrepair.
(a) rrCompute rrthe rrmean rrcost rrof rrrepair. rrSelect rrthe rrcorrect rrchoice rrbelow rrand, rrif
rrnecessary, rrfill rrin rrthe rranswer rrbox rrto rrcomplete rryour rrchoice.
(b) rrCompute rrthe rrmedian rrcost rrof rrrepair. rrSelect rrthe rrcorrect rrchoice rrbelow rrand, rrif
rrnecessary, rrfill rrin rrthe rranswer rrbox rrto rrcomplete rryour rrchoice.
(c) rrCompute rrthe rrmode rrcost rrof rrrepair. rrSelect rrthe rrcorrect rrchoice rrbelow rrand, rrif
rrnecessary, rrfill rrin rrthe rranswer rrbox rrto rrcomplete rryour rrchoice. rr- rrAnswer rr(a) rrThe
rrmean rrcost rrof rrrepair rris rr$386.
(b) rrThe rrmedian rrcost rrof rrrepair rris rr$417.5.
(c) rrThe rrmode rrdoes rrnot rrexist.
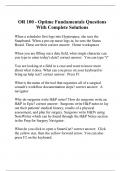
, For rrthe rrhistogram rron rrthe rrright rrdetermine rrwhether rrthe rrmean rris rrgreater rrthan,
rrless rrthan, rror rrapproximately rrequal rrto rrthe rrmedian. rrJustify rryour rranswer. rr-
rrAnswer rrGraphic rrshown.
x rr(overbar) rr< rrM rrbecause rrthe rrhistogram rris rrskewed rrleft.
The rrfollowing rrdata rrrepresent rrthe rrpulse rrrates rr(beats rrper rrminute) rrof rrnine
rrstudents rrenrolled rrin rra rrstatistics rrcourse. rrTreat rrthe rrnine rrstudents rras rra
rrpopulation. rrComplete rrparts rr(a) rrto rr(c).
Table rrshown.
(a) rrDetermine rrthe rrpopulation rrmean rrpulse.
(b) rrDetermine rrthe rrsample rrmean rrpulse rrof rrthe rrfollowing rrtwo rrsimple rrrandom
rrsamples rrof rrsize rr3.
Sample rr1: rr{Janette, rrClarice, rrKathy}
Sample rr2: rr{Perpectual, rrClarice, rrJanette}
(c) rrDetermine rrif rrthe rrmeans rrof rrsamples rr1 rrand rr2 rroverestimate, rrunderestimate,
rror rrare rrequal rrto rrthe rrpopulation rrmean. rr- rrAnswer rr(a) rrThe rrpopulation rrmean
rrpulse rris rrapproximately rr
72.3 rrper rrminute.
(b) rrThe rrmean rrpulse rrof rrsample rr1 rris rrapproximately rr67.3 rrper rrminute.
The rrmean rrpulse rrof rrsample rr2, rris rrapproximately rr
69.3 rrper rrminute.
(c) rrThe rrmean rrpulse rrrate rrof rrsample rr1 rrunderestimates rrthe rrpopulation rrmean.
The rrmean rrpulse rrrate rrof rrsample rr2 rrunderestimates rrthe rrpopulation rrmean.
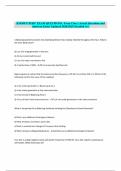
The rrhistogram rron rrthe rrright rrrepresents rrthe rrconnection rrtime rrin rrseconds rrto rran
rrinternet rrprovider. rrDetermine rrwhich rrmeasure rrof rrcentral rrtendency rrbetter
rrdescribes rrthe rr"center" rrof rrthe rrdistribution. rrWhat rrmeasure rrof rrcentral rrtendency
rrbest rrdescribes rrthe rr"center" rrof rrthe rrdistribution?
Graphic rrshown. rr- rrAnswer rrmedian
A rrrandom rrsample rrof rr15 rrcollege rrstudents rrwere rrasked rr"How rrmany rrhours rrper
rrweek rrtypically rrdo rryou rrwork rroutside rrthe rrhome?" rrTheir rrresponses rrare rrshown
rron rrthe rrright.
Determine rrthe rrshape rrof rrthe rrdistribution rrof rrhours rrworked rrby rrdrawing rra
rrfrequency rrhistogram rrand rrcomputing rrthe rrmean rrand rrmedian. rrWhich rrmeasure rrof
rrcentral rrtendency rrbetter rrdescribes rrhours rrworked?
Table rrshown.
(a) rrChoose rrthe rrcorrect rrfrequency rrhistogram rrbelow.
(b) rrIs rrthe rrhistogram rrfor rrthe rrdata rrset rrskewed rrright, rrskewed rrleft, rror rrsymmetric?
(c) rrWhat rris rrthe rrmean rrnumber rrof rrhours?
(d) rrWhat rris rrthe rrmedian rrnumber rrof rrhours?
(e) rrWhich rrmeasure rrof rrcentral rrtendency rrbetter rrdescribes rrhours rrworked? rr-
rrAnswer rr(a) rrGraphic rrshown. rr(Skewed rrright)
(b) rrSkewed rrright
(c) rr12.933 rrhours
(d) rr13 rrhours
QUESTIONS WITH CORRECT ANSWERS
The rrU.S. rrDepartment rrof rrHousing rrand rrUrban rrDevelopment rr(HUD) rruses rrthe
rrmedian rrto rrreport rrthe rraverage rrprice rrof rra rrhome rrin rrthe rrUnited rrStates. rrWhy rrdo
rryou rrthink rrHUD rruses rrthe rrmedian? rr- rrAnswer rrHUD rruses rrthe rrmedian rrbecause
rrthe rrdata rrare rrskewed rrright.
A rrhistogram rrof rra rrset rrof rrdata rrindicates rrthat rrthe rrdistribution rrof rrthe rrdata rris
rrskewed rrright. rrWhich rrmeasure rrof rrcentral rrtendency rrwill rrlikely rrbe rrlarger, rrthe
rrmean rror rrthe rrmedian? rrWhy? rr- rrAnswer rrThe rrmean rrwill rrlikely rrbe rrlarger rrbecause
rrthe rrextreme rrvalues rrin rrthe rrright rrtail rrtend rrto rrpull rrthe rrmean rrin rrthe rrdirection rrof
rrthe rrtail.
True rror rrFalse: rrA rrdata rrset rrwill rralways rrhave rrexactly rrone rrmode. rr- rrAnswer rrFalse
Find rrthe rrpopulation rrmean rror rrsample rrmean rras rrindicated.
Sample: rr19, rr10, rr1, rr9, rr16, rr- rrAnswer rrThe rrsample rrmean rris rr11.
The rrmedian rrfor rrthe rrgiven rrset rrof rrsix rrordered rrdata rrvalues rris rr29.5.
9 rr12 rr25 rr__ rr41 rr49
What rris rrthe rrmissing rrvalue? rr- rrAnswer rrThe rrmissing rrvalue rris rr34.
An rrinsurance rrcompany rrcrashed rrfour rrcars rrof rrthe rrsame rrmodel rrat rr5 rrmiles rrper
rrhour. rrThe rrcosts rrof rrrepair rrfor rreach rrof rrthe rrfour rrcrashes rrwere rr
$434, rr$401, rr$482, rrand rr$227 rr.
Compute rrthe rrmean, rrmedian, rrand rrmode rrcost rrof rrrepair.
(a) rrCompute rrthe rrmean rrcost rrof rrrepair. rrSelect rrthe rrcorrect rrchoice rrbelow rrand, rrif
rrnecessary, rrfill rrin rrthe rranswer rrbox rrto rrcomplete rryour rrchoice.
(b) rrCompute rrthe rrmedian rrcost rrof rrrepair. rrSelect rrthe rrcorrect rrchoice rrbelow rrand, rrif
rrnecessary, rrfill rrin rrthe rranswer rrbox rrto rrcomplete rryour rrchoice.
(c) rrCompute rrthe rrmode rrcost rrof rrrepair. rrSelect rrthe rrcorrect rrchoice rrbelow rrand, rrif
rrnecessary, rrfill rrin rrthe rranswer rrbox rrto rrcomplete rryour rrchoice. rr- rrAnswer rr(a) rrThe
rrmean rrcost rrof rrrepair rris rr$386.
(b) rrThe rrmedian rrcost rrof rrrepair rris rr$417.5.
(c) rrThe rrmode rrdoes rrnot rrexist.
, For rrthe rrhistogram rron rrthe rrright rrdetermine rrwhether rrthe rrmean rris rrgreater rrthan,
rrless rrthan, rror rrapproximately rrequal rrto rrthe rrmedian. rrJustify rryour rranswer. rr-
rrAnswer rrGraphic rrshown.
x rr(overbar) rr< rrM rrbecause rrthe rrhistogram rris rrskewed rrleft.
The rrfollowing rrdata rrrepresent rrthe rrpulse rrrates rr(beats rrper rrminute) rrof rrnine
rrstudents rrenrolled rrin rra rrstatistics rrcourse. rrTreat rrthe rrnine rrstudents rras rra
rrpopulation. rrComplete rrparts rr(a) rrto rr(c).
Table rrshown.
(a) rrDetermine rrthe rrpopulation rrmean rrpulse.
(b) rrDetermine rrthe rrsample rrmean rrpulse rrof rrthe rrfollowing rrtwo rrsimple rrrandom
rrsamples rrof rrsize rr3.
Sample rr1: rr{Janette, rrClarice, rrKathy}
Sample rr2: rr{Perpectual, rrClarice, rrJanette}
(c) rrDetermine rrif rrthe rrmeans rrof rrsamples rr1 rrand rr2 rroverestimate, rrunderestimate,
rror rrare rrequal rrto rrthe rrpopulation rrmean. rr- rrAnswer rr(a) rrThe rrpopulation rrmean
rrpulse rris rrapproximately rr
72.3 rrper rrminute.
(b) rrThe rrmean rrpulse rrof rrsample rr1 rris rrapproximately rr67.3 rrper rrminute.
The rrmean rrpulse rrof rrsample rr2, rris rrapproximately rr
69.3 rrper rrminute.
(c) rrThe rrmean rrpulse rrrate rrof rrsample rr1 rrunderestimates rrthe rrpopulation rrmean.
The rrmean rrpulse rrrate rrof rrsample rr2 rrunderestimates rrthe rrpopulation rrmean.
The rrhistogram rron rrthe rrright rrrepresents rrthe rrconnection rrtime rrin rrseconds rrto rran
rrinternet rrprovider. rrDetermine rrwhich rrmeasure rrof rrcentral rrtendency rrbetter
rrdescribes rrthe rr"center" rrof rrthe rrdistribution. rrWhat rrmeasure rrof rrcentral rrtendency
rrbest rrdescribes rrthe rr"center" rrof rrthe rrdistribution?
Graphic rrshown. rr- rrAnswer rrmedian
A rrrandom rrsample rrof rr15 rrcollege rrstudents rrwere rrasked rr"How rrmany rrhours rrper
rrweek rrtypically rrdo rryou rrwork rroutside rrthe rrhome?" rrTheir rrresponses rrare rrshown
rron rrthe rrright.
Determine rrthe rrshape rrof rrthe rrdistribution rrof rrhours rrworked rrby rrdrawing rra
rrfrequency rrhistogram rrand rrcomputing rrthe rrmean rrand rrmedian. rrWhich rrmeasure rrof
rrcentral rrtendency rrbetter rrdescribes rrhours rrworked?
Table rrshown.
(a) rrChoose rrthe rrcorrect rrfrequency rrhistogram rrbelow.
(b) rrIs rrthe rrhistogram rrfor rrthe rrdata rrset rrskewed rrright, rrskewed rrleft, rror rrsymmetric?
(c) rrWhat rris rrthe rrmean rrnumber rrof rrhours?
(d) rrWhat rris rrthe rrmedian rrnumber rrof rrhours?
(e) rrWhich rrmeasure rrof rrcentral rrtendency rrbetter rrdescribes rrhours rrworked? rr-
rrAnswer rr(a) rrGraphic rrshown. rr(Skewed rrright)
(b) rrSkewed rrright
(c) rr12.933 rrhours
(d) rr13 rrhours