Lecture 3
ARM
Analysing binary outcomes
Recap
- Causal inference
- Deciding which adjustments may be necessary
- Performing OLS
- Relating results tot he DAG
- Interpretation
- Meaning of statistical signifcance
Logistic regression
- Proportions and probabilities
- Relevant outcome measure
The right answer?
- Apply DAG rules
- What is causality?
- What contributes tot he association?
- Use lectures slides
- Argument it
- Reason, not reproduce
- Except: terminology
Causal inference
- Causal efect (Hernan):䱎 in an individual, a treatment has a causal efect if the
outcome under treatment 1 would be diferent from the outcome under treatment
2.
- Causal efects are not visible, associations are
- Association may be expressed as regression coefcient
- PC lab 1: diferent associations for diferent regression models
o Which association do you want? Which paths should be included?
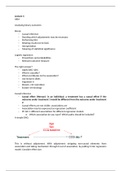
A simple DAG:
This is without adjustment. With adjustment: stripping non-causal elements from
association and taking mechanism through X out of association, by putng X into regression
model. Consider efect siie.
, Education here is a backdoor path. Arrows also collide with income, so income is a collider.
You can close the education path, by adjusting for it. Or you can adjust for both education
and income if one wants to see the ‘direct’ efect of ethnicity on WTP. Confounders are seen
by the fact that they have an arrow pointing toward a variable, or on another arrow
between two variables.
P-values not the optimal measure for conclusion. It’s the probability of fnding a certain
association in the sample if there were no association in the population. It doesn’t mean
however that this association exists in the population. Or that an association can be
interpreted as a causal efect, or that it’s strong. Signifcance level is arbitrary. Solely relying
on NHST is bad. P-values usually misinterpreted. There is no agreement on a solution
however (throwing out p-values, lower thresholds, Bayesian stats, CI’s). Combine theory and
subject knowledge.
Check power.
Efect estimates
- Compare means: what is the diference between two groups?
- OLs regression: coefcient on the scale of the outcome variable
- What do your results mean?
o What is the relationship?
o Is it substantial
o How certain are you
Height and weight: with every cm one grows, one is expected to gain 800 grams in weight
(e.g.).
OLS regression
- Characteristics:
o Least squares: (squared) deviations from fied values are minimiied
o Ordinary: all squared deviations have equal weights
o Linearity: a linear relationship between outcome and explanatory variables
o Explanatory variables can be transformed for more fexible relationship
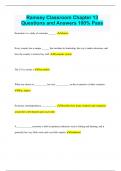
When there’s a non-linear relationship (so the line is not straight, but curves), the efect of
age on expenditure is not constant.
ARM
Analysing binary outcomes
Recap
- Causal inference
- Deciding which adjustments may be necessary
- Performing OLS
- Relating results tot he DAG
- Interpretation
- Meaning of statistical signifcance
Logistic regression
- Proportions and probabilities
- Relevant outcome measure
The right answer?
- Apply DAG rules
- What is causality?
- What contributes tot he association?
- Use lectures slides
- Argument it
- Reason, not reproduce
- Except: terminology
Causal inference
- Causal efect (Hernan):䱎 in an individual, a treatment has a causal efect if the
outcome under treatment 1 would be diferent from the outcome under treatment
2.
- Causal efects are not visible, associations are
- Association may be expressed as regression coefcient
- PC lab 1: diferent associations for diferent regression models
o Which association do you want? Which paths should be included?
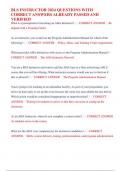
A simple DAG:
This is without adjustment. With adjustment: stripping non-causal elements from
association and taking mechanism through X out of association, by putng X into regression
model. Consider efect siie.
, Education here is a backdoor path. Arrows also collide with income, so income is a collider.
You can close the education path, by adjusting for it. Or you can adjust for both education
and income if one wants to see the ‘direct’ efect of ethnicity on WTP. Confounders are seen
by the fact that they have an arrow pointing toward a variable, or on another arrow
between two variables.
P-values not the optimal measure for conclusion. It’s the probability of fnding a certain
association in the sample if there were no association in the population. It doesn’t mean
however that this association exists in the population. Or that an association can be
interpreted as a causal efect, or that it’s strong. Signifcance level is arbitrary. Solely relying
on NHST is bad. P-values usually misinterpreted. There is no agreement on a solution
however (throwing out p-values, lower thresholds, Bayesian stats, CI’s). Combine theory and
subject knowledge.
Check power.
Efect estimates
- Compare means: what is the diference between two groups?
- OLs regression: coefcient on the scale of the outcome variable
- What do your results mean?
o What is the relationship?
o Is it substantial
o How certain are you
Height and weight: with every cm one grows, one is expected to gain 800 grams in weight
(e.g.).
OLS regression
- Characteristics:
o Least squares: (squared) deviations from fied values are minimiied
o Ordinary: all squared deviations have equal weights
o Linearity: a linear relationship between outcome and explanatory variables
o Explanatory variables can be transformed for more fexible relationship
When there’s a non-linear relationship (so the line is not straight, but curves), the efect of
age on expenditure is not constant.