STK110 TUT 1&2: Preparation sheet MEMORANDUM 2023
1. For this question you are expected to use the survey data available in the Tutorials section on
ClickUP.
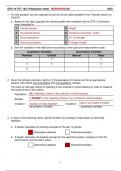
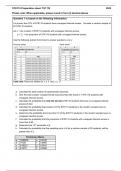
a. Based on this data, populate the following table with variables that the STK110 lecturers
were interested in.
1 Internet access 5 Height
2 Household chores 6 Number of countries visited
3 Excel experience 7 Gr 12 average
4 Internet connection 8 Transport mode
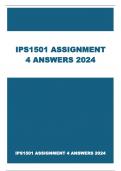
b. Sort the variables in the table above according to their type and measurement scale.
Qualitative Variables Quantitative Variables
Nominal Ordinal Interval Ratio
1 3 5
2 4 6
8 7
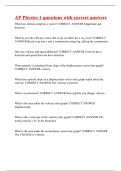
2. Given the following scenario, define (1) the population of interest and (2) an appropriate
sample. Also define one quantitative and one qualitative variable.
You want to interview victims of hijacking in two suburbs of Johannesburg in order to measure
the stress levels of the victims.
Population: ALL hijacking victims in two suburbs of Johannesburg
Sample: A SUBSET of the hijacking victims in two suburbs of Johannesburg
Variable 1: Number of times hijacked Variable 2: Type of car (make & model)
(quantitative variable) (qualitative variable)
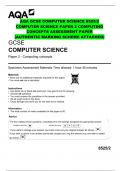
3. In each of the following cases, identify whether the example is descriptive or inferential
statistics:
a. A bowler calculates his bowling average for the last 12 games.
Descriptive statistics Inferential statistics
b. A bowler estimates his bowling average for the upcoming season, keeping in mind his
performance over the last 3 years.
Descriptive statistics Inferential statistics
1
1. For this question you are expected to use the survey data available in the Tutorials section on
ClickUP.
a. Based on this data, populate the following table with variables that the STK110 lecturers
were interested in.
1 Internet access 5 Height
2 Household chores 6 Number of countries visited
3 Excel experience 7 Gr 12 average
4 Internet connection 8 Transport mode
b. Sort the variables in the table above according to their type and measurement scale.
Qualitative Variables Quantitative Variables
Nominal Ordinal Interval Ratio
1 3 5
2 4 6
8 7
2. Given the following scenario, define (1) the population of interest and (2) an appropriate
sample. Also define one quantitative and one qualitative variable.
You want to interview victims of hijacking in two suburbs of Johannesburg in order to measure
the stress levels of the victims.
Population: ALL hijacking victims in two suburbs of Johannesburg
Sample: A SUBSET of the hijacking victims in two suburbs of Johannesburg
Variable 1: Number of times hijacked Variable 2: Type of car (make & model)
(quantitative variable) (qualitative variable)
3. In each of the following cases, identify whether the example is descriptive or inferential
statistics:
a. A bowler calculates his bowling average for the last 12 games.
Descriptive statistics Inferential statistics
b. A bowler estimates his bowling average for the upcoming season, keeping in mind his
performance over the last 3 years.
Descriptive statistics Inferential statistics
1