Inhoudsopgave
Unit 12 – Causality and bivariate causal hypotheses..................................................................................... 2
Causal explanation .............................................................................................................................................. 2
Time order in causal relationships – X precedes Y in time................................................................................. 5
The effect of third variables – Spuriousness / Non-spuriousness ...................................................................... 6
Bivariate associations ......................................................................................................................................... 8
Understanding causal relationships *the corona version* ............................................................................... 9
A short guide to asking research questions, to hypothesis construction and to basic data analysis using
crosstabs .................................................................................................................................................. 14
Unit 15 – Research designs for testing causal hypotheses ........................................................................... 15
Research designs for testing bivariate causal relationships ........................................................................... 15
Validity in causal research ................................................................................................................................ 18
The classical experiment (/ randomized experiment) ..................................................................................... 19
Cross-sectional research.................................................................................................................................... 21
Interrupted time series...................................................................................................................................... 22
A notation of research designs ......................................................................................................................... 23
Research design for testing causality & the bobo doll experiment ................................................................ 26
Research designs for testing causality & SIRE Campaign ................................................................................ 28
Unit 14 – Causality and the effect of third variables ................................................................................... 28
The effect of third variables – thinking about trivariate hypotheses ............................................................. 28
Notes Q&A 15/10 ..................................................................................................................................... 32
Unit 16 & 17 – Elaboration: analyzing multi-variate relationships using tables ............................................ 35
Testing a trivariate hypothesis using a trivariate table .................................................................................. 35
Van der Kolk P. 19 - 23 .............................................................................................................................. 36
Unit 17 – Trivariate tables: specification ......................................................................................................... 38
Unit 17 – Trivariate tables: addition ................................................................................................................ 38
Unit SPSS4 – How to display multivariate data/relationships using SPSS ..................................................... 39
Basic multi-variate analysis in SPSS: 3 way tables and scatterplots in SPSS .................................................. 39
(Unit 17) Storks and tables in SPSS ................................................................................................................... 41
Q&A – Unit 16, 17, 18 ............................................................................................................................... 43
1
,Notes test 2
Unit 12 – Causality and bivariate causal hypotheses
Causal explanation
Three different, yet related questions
1. Reasons (precedes causes) → ‘Why did YOU become an alcoholic?’
2. ‘Why did THIS PERSON become an alcoholic?’
3. ‘Why do PEOPLE become alcoholics?’ → more general, focus will be on this later on
in this lecture!
Reasons
1. ‘Why did YOU become an alcoholic?’
- Tells a ‘story’ with reasons (abuse > insecure > drinking > made mistakes > drinking
etc..)
- You could check (parts of) the story (= follow-up)
- Biographies / therapeutic sessions
- Can be a starting point for more general ‘theories’
Diagnostic analysis
2. ‘Why did THIS PERSON become an alcoholic?’ (suppose the person died)
- Answering the questing using knowledge about ‘why things generally happen’
= use existing knowledge applied to a specific case
- Y is the case (person was an alcoholic)
- X is a cause of Y (bad childhood → alcoholism)
- X is the case (had a bad childhood)
- Y maybe caused by x (alcoholism because of bad childhood)
Using causal hypotheses to offer an explanation
Does not improve our general knowledge about causes
Developing and testing general hypotheses
3. Why do PEOPLE become alcoholics?
- Thinking about possible causes: ‘alcohol acceptance’ during childhood, makes it more
likely to become an alcoholic
- Explanation as formulating and testing a relationship between a cause and a
consequence
2
, Relationships
- When talking about theory → exogenous/endogenous concept
- E.g.: level of alcohol acceptance in the family you grew up in → amount of
drinking/being an alcoholic
Causality in a graph
- X-axis = independent variable
- Y-axis = dependent variable
- Line is showing a positive relationship!
- Negative relationship would be from up (left side) to down (right side)
- SIGN of the relationship = ‘positive’ or ‘negative’ = direction
Deterministic and probabilistic relationships
Deterministic
= If …. then ‘always’
Probabilistic (more often used in social sciences)
= if.. then ‘relatively more/less often’
- Positive relationship between dependent and independent variable
- On the right side we expect the line not the dots!
Why probabilistic only?
3
Unit 12 – Causality and bivariate causal hypotheses..................................................................................... 2
Causal explanation .............................................................................................................................................. 2
Time order in causal relationships – X precedes Y in time................................................................................. 5
The effect of third variables – Spuriousness / Non-spuriousness ...................................................................... 6
Bivariate associations ......................................................................................................................................... 8
Understanding causal relationships *the corona version* ............................................................................... 9
A short guide to asking research questions, to hypothesis construction and to basic data analysis using
crosstabs .................................................................................................................................................. 14
Unit 15 – Research designs for testing causal hypotheses ........................................................................... 15
Research designs for testing bivariate causal relationships ........................................................................... 15
Validity in causal research ................................................................................................................................ 18
The classical experiment (/ randomized experiment) ..................................................................................... 19
Cross-sectional research.................................................................................................................................... 21
Interrupted time series...................................................................................................................................... 22
A notation of research designs ......................................................................................................................... 23
Research design for testing causality & the bobo doll experiment ................................................................ 26
Research designs for testing causality & SIRE Campaign ................................................................................ 28
Unit 14 – Causality and the effect of third variables ................................................................................... 28
The effect of third variables – thinking about trivariate hypotheses ............................................................. 28
Notes Q&A 15/10 ..................................................................................................................................... 32
Unit 16 & 17 – Elaboration: analyzing multi-variate relationships using tables ............................................ 35
Testing a trivariate hypothesis using a trivariate table .................................................................................. 35
Van der Kolk P. 19 - 23 .............................................................................................................................. 36
Unit 17 – Trivariate tables: specification ......................................................................................................... 38
Unit 17 – Trivariate tables: addition ................................................................................................................ 38
Unit SPSS4 – How to display multivariate data/relationships using SPSS ..................................................... 39
Basic multi-variate analysis in SPSS: 3 way tables and scatterplots in SPSS .................................................. 39
(Unit 17) Storks and tables in SPSS ................................................................................................................... 41
Q&A – Unit 16, 17, 18 ............................................................................................................................... 43
1
,Notes test 2
Unit 12 – Causality and bivariate causal hypotheses
Causal explanation
Three different, yet related questions
1. Reasons (precedes causes) → ‘Why did YOU become an alcoholic?’
2. ‘Why did THIS PERSON become an alcoholic?’
3. ‘Why do PEOPLE become alcoholics?’ → more general, focus will be on this later on
in this lecture!
Reasons
1. ‘Why did YOU become an alcoholic?’
- Tells a ‘story’ with reasons (abuse > insecure > drinking > made mistakes > drinking
etc..)
- You could check (parts of) the story (= follow-up)
- Biographies / therapeutic sessions
- Can be a starting point for more general ‘theories’
Diagnostic analysis
2. ‘Why did THIS PERSON become an alcoholic?’ (suppose the person died)
- Answering the questing using knowledge about ‘why things generally happen’
= use existing knowledge applied to a specific case
- Y is the case (person was an alcoholic)
- X is a cause of Y (bad childhood → alcoholism)
- X is the case (had a bad childhood)
- Y maybe caused by x (alcoholism because of bad childhood)
Using causal hypotheses to offer an explanation
Does not improve our general knowledge about causes
Developing and testing general hypotheses
3. Why do PEOPLE become alcoholics?
- Thinking about possible causes: ‘alcohol acceptance’ during childhood, makes it more
likely to become an alcoholic
- Explanation as formulating and testing a relationship between a cause and a
consequence
2
, Relationships
- When talking about theory → exogenous/endogenous concept
- E.g.: level of alcohol acceptance in the family you grew up in → amount of
drinking/being an alcoholic
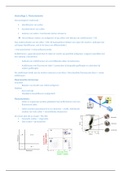
Causality in a graph
- X-axis = independent variable
- Y-axis = dependent variable
- Line is showing a positive relationship!
- Negative relationship would be from up (left side) to down (right side)
- SIGN of the relationship = ‘positive’ or ‘negative’ = direction
Deterministic and probabilistic relationships
Deterministic
= If …. then ‘always’
Probabilistic (more often used in social sciences)
= if.. then ‘relatively more/less often’
- Positive relationship between dependent and independent variable
- On the right side we expect the line not the dots!
Why probabilistic only?
3