Inhoudsopgave
Unit 8 – Two aspects of data quality ............................................................................................................ 2
Reliability and validity in measurement .............................................................................................................. 2
Measurement reliability ....................................................................................................................................... 5
Measurement validity .......................................................................................................................................... 9
Measurement reliability ..................................................................................................................................... 11
Standardization, validity and reliability ............................................................................................................. 11
Notes – introduction in reliability and validity assessment ......................................................................... 12
SPSS3 – How to display data using SPSS..................................................................................................... 16
Part A. Univariate analysis (Unit 9).................................................................................................................... 16
Frequency tables in SPSS.............................................................................................................................. 16
SPSS Unit 3 – Frequency tables, bar chart, pie chart, & multiple or cluster bar chart ................................. 17
Part B. Bivariate analysis (Unit 13) .................................................................................................................... 20
Cross tabs in SPSS ......................................................................................................................................... 20
Unit 9 – Displaying univariate data ............................................................................................................ 22
Mode, median and mean ................................................................................................................................... 22
Graphs and shapes of distributions ................................................................................................................... 22
Q&A Week 3 – 24 september .................................................................................................................... 25
Unit 10 – Summarizing ratio variables ....................................................................................................... 31
Variance and standard deviation ....................................................................................................................... 31
Introducing the boxplot ..................................................................................................................................... 32
Unit 11 – Distributions and Z-scores .......................................................................................................... 36
Unit 23 – Normal distribution.................................................................................................................... 37
Introduction to the normal distribution ............................................................................................................. 37
Q&A – Week 4 .......................................................................................................................................... 40
Unit 13 – Visualizing and analyzing bivariate relationships ......................................................................... 50
Contingency tables and scatterplots ................................................................................................................ 50
Unit 24 – Describing the association between two variables....................................................................... 51
Spearman’s p (rho)............................................................................................................................................. 53
Kendall’s T (tau) ................................................................................................................................................. 53
Pearson’s R ......................................................................................................................................................... 53
Q&A Session 7/10..................................................................................................................................... 55
1
,Unit 8 – Two aspects of data quality
Reliability and validity in measurement
Assessing operationalization & measurement
Even when we observe the right set of units, observation may be imperfect: we make
mistakes
Two types of observation mistakes:
- Random errors (can be anything and happen accidentally)
- Systematic errors (happens systematic. Two categories: systematic bias or measuring
the wrong construct)
Two different ways of assessing an operationalization (quality of measurement instruments):
1. Measurement reliability = the absence of random error
2. Measurement validity = no systematic error, (on average) measure what you intend to
measure (= on average we measure what we want to measure)
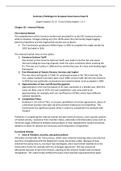
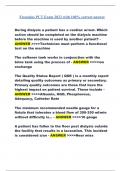
Example
Operationalize ‘weight’ using a scale;
Every individual steps on the scale 10 times;
Use three different scales (= three operationalizations);
Assess the operationalization using the reliability
→ since this happens at the same time more or less, we can argue the scale is not reliable
→ smaller differences than the first scale (see picture of ‘scale 1’), so somewhat reliable
2
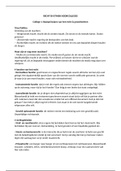
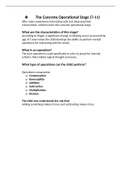
, Measurement validity
The operationalization may be ‘reliable’…. But is it also correct (valid, unbiased)?
→ true weight says 77 kilos, but reliable weight says 80 kilos. So this reliable, but not valid!
Assessing measurement validity
Validity of an operationalization cannot be observed directly, because the ‘true’ value is
unknown…
Three approaches to measurement validity:
- Content validity
- Criterion validity
- Construct validity
Content validity
Does it cover all aspects of the concept?
3
Unit 8 – Two aspects of data quality ............................................................................................................ 2
Reliability and validity in measurement .............................................................................................................. 2
Measurement reliability ....................................................................................................................................... 5
Measurement validity .......................................................................................................................................... 9
Measurement reliability ..................................................................................................................................... 11
Standardization, validity and reliability ............................................................................................................. 11
Notes – introduction in reliability and validity assessment ......................................................................... 12
SPSS3 – How to display data using SPSS..................................................................................................... 16
Part A. Univariate analysis (Unit 9).................................................................................................................... 16
Frequency tables in SPSS.............................................................................................................................. 16
SPSS Unit 3 – Frequency tables, bar chart, pie chart, & multiple or cluster bar chart ................................. 17
Part B. Bivariate analysis (Unit 13) .................................................................................................................... 20
Cross tabs in SPSS ......................................................................................................................................... 20
Unit 9 – Displaying univariate data ............................................................................................................ 22
Mode, median and mean ................................................................................................................................... 22
Graphs and shapes of distributions ................................................................................................................... 22
Q&A Week 3 – 24 september .................................................................................................................... 25
Unit 10 – Summarizing ratio variables ....................................................................................................... 31
Variance and standard deviation ....................................................................................................................... 31
Introducing the boxplot ..................................................................................................................................... 32
Unit 11 – Distributions and Z-scores .......................................................................................................... 36
Unit 23 – Normal distribution.................................................................................................................... 37
Introduction to the normal distribution ............................................................................................................. 37
Q&A – Week 4 .......................................................................................................................................... 40
Unit 13 – Visualizing and analyzing bivariate relationships ......................................................................... 50
Contingency tables and scatterplots ................................................................................................................ 50
Unit 24 – Describing the association between two variables....................................................................... 51
Spearman’s p (rho)............................................................................................................................................. 53
Kendall’s T (tau) ................................................................................................................................................. 53
Pearson’s R ......................................................................................................................................................... 53
Q&A Session 7/10..................................................................................................................................... 55
1
,Unit 8 – Two aspects of data quality
Reliability and validity in measurement
Assessing operationalization & measurement
Even when we observe the right set of units, observation may be imperfect: we make
mistakes
Two types of observation mistakes:
- Random errors (can be anything and happen accidentally)
- Systematic errors (happens systematic. Two categories: systematic bias or measuring
the wrong construct)
Two different ways of assessing an operationalization (quality of measurement instruments):
1. Measurement reliability = the absence of random error
2. Measurement validity = no systematic error, (on average) measure what you intend to
measure (= on average we measure what we want to measure)
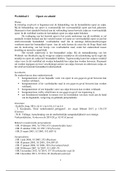
Example
Operationalize ‘weight’ using a scale;
Every individual steps on the scale 10 times;
Use three different scales (= three operationalizations);
Assess the operationalization using the reliability
→ since this happens at the same time more or less, we can argue the scale is not reliable
→ smaller differences than the first scale (see picture of ‘scale 1’), so somewhat reliable
2
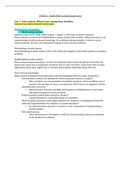
, Measurement validity
The operationalization may be ‘reliable’…. But is it also correct (valid, unbiased)?
→ true weight says 77 kilos, but reliable weight says 80 kilos. So this reliable, but not valid!
Assessing measurement validity
Validity of an operationalization cannot be observed directly, because the ‘true’ value is
unknown…
Three approaches to measurement validity:
- Content validity
- Criterion validity
- Construct validity
Content validity
Does it cover all aspects of the concept?
3