10/24/23, 10:58 AM STA 1053 Sample Final Exam
Name:_________________________________
SAMPLE FINAL EXAM
Directions: Mark your final answer to each question on the Parscore form.
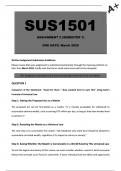
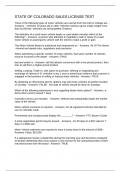
In an effort to improve customer service, Dell monitors the time customers wait on hold
when calling in for support. The following summary data represents the wait times in
minutes for the last 50 callers. Answer questions #1 - 4.
1. Describe the variable of interest in this study, and choose the type of variable.
a. Wait Time for Dell support, quantitative
b. All callers to Dell for support, qualitative
c. 50 callers to Dell for support, quantitative
d. Proportion of callers to Dell for support, qualitative
2. Describe the sample of interest in this study.
a. Wait Time for Dell support
b. All callers to Dell for support
c. 50 callers to Dell for support
d. Proportion of callers to Dell for support
3. Approximately what proportion of callers have to wait less than 6 minutes?
a. 36% b. 46% c. 18 d. 23
4. How many customers had to wait less than 3 minutes for support?
a. 46% b. 36% c. 5 d. 10
1
about:blank 1/10
, 10/24/23, 10:58 AM STA 1053 Sample Final Exam
Name:_________________________________
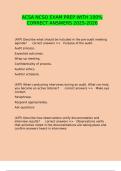
The airline industry defines an on-time flight as one that arrives within 15 minutes of its
scheduled time. The following table shows the on-time and late flights leaving San Antonio
and arriving in Dallas for one month. Use the information in the table to answer all
questions. Answer questions #5 - 7.
Airline On-Time Late Total
Southwest 239 68 307
US Airways 288 418
American 180 63 243
Total 707 261 968
5. What is the probability that a randomly selected flight was On-Time?
a. 0.73 b. 0.27 c. 0.25 d. 0.70
6. If the flight was from Southwest, what’s the probability that it arrived late?
a. 0.26 b. 0.07 c. 0.22 d. 0.68
7. Which airlines is most likely to have late arrivals?
a. Southwest b. US Airways c. American d. Not enough information
Scores on the GRE (Graduate Record Examination) are considered to be normally
distributed. The average quantitative portion of the GRE for 2014 was a 151.3 with
standard deviation 8.7. Answer questions #8 - 10.
8. Compute the z-score for a GRE score of 140.
a. -1.30 b. 1.30 c. -3.83 d. 3.83
9. What’s the probability a randomly selected individual scored lower than 140?
a. 0.903 b. approximately 0 c. approximately 1 d. 0.097
10. What’s the probability a randomly selected individual scored higher than 155?
a. 0.43 b. 0.67 c. 0.33 d. 3.70
2
about:blank 2/10
Name:_________________________________
SAMPLE FINAL EXAM
Directions: Mark your final answer to each question on the Parscore form.
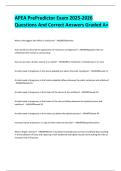
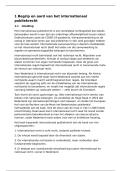
In an effort to improve customer service, Dell monitors the time customers wait on hold
when calling in for support. The following summary data represents the wait times in
minutes for the last 50 callers. Answer questions #1 - 4.
1. Describe the variable of interest in this study, and choose the type of variable.
a. Wait Time for Dell support, quantitative
b. All callers to Dell for support, qualitative
c. 50 callers to Dell for support, quantitative
d. Proportion of callers to Dell for support, qualitative
2. Describe the sample of interest in this study.
a. Wait Time for Dell support
b. All callers to Dell for support
c. 50 callers to Dell for support
d. Proportion of callers to Dell for support
3. Approximately what proportion of callers have to wait less than 6 minutes?
a. 36% b. 46% c. 18 d. 23
4. How many customers had to wait less than 3 minutes for support?
a. 46% b. 36% c. 5 d. 10
1
about:blank 1/10
, 10/24/23, 10:58 AM STA 1053 Sample Final Exam
Name:_________________________________
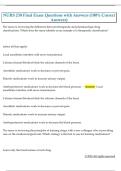
The airline industry defines an on-time flight as one that arrives within 15 minutes of its
scheduled time. The following table shows the on-time and late flights leaving San Antonio
and arriving in Dallas for one month. Use the information in the table to answer all
questions. Answer questions #5 - 7.
Airline On-Time Late Total
Southwest 239 68 307
US Airways 288 418
American 180 63 243
Total 707 261 968
5. What is the probability that a randomly selected flight was On-Time?
a. 0.73 b. 0.27 c. 0.25 d. 0.70
6. If the flight was from Southwest, what’s the probability that it arrived late?
a. 0.26 b. 0.07 c. 0.22 d. 0.68
7. Which airlines is most likely to have late arrivals?
a. Southwest b. US Airways c. American d. Not enough information
Scores on the GRE (Graduate Record Examination) are considered to be normally
distributed. The average quantitative portion of the GRE for 2014 was a 151.3 with
standard deviation 8.7. Answer questions #8 - 10.
8. Compute the z-score for a GRE score of 140.
a. -1.30 b. 1.30 c. -3.83 d. 3.83
9. What’s the probability a randomly selected individual scored lower than 140?
a. 0.903 b. approximately 0 c. approximately 1 d. 0.097
10. What’s the probability a randomly selected individual scored higher than 155?
a. 0.43 b. 0.67 c. 0.33 d. 3.70
2
about:blank 2/10