Summary
Summary Week 3
Rating
Sold
-
Pages
2
Uploaded on
15-07-2023
Written in
2022/2023
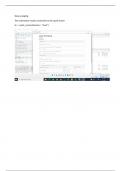
The text is Mastering Spark with R. After installing the dplyr library, use the following code in R studio, create a scatter plot of hp v. mpg cars2 - copy_to(sc, mtcars) cars3 - (cars2) cars4 - select(cars3, hp, mpg) cars5 - sample_n(cars4, 32) cars6 - collect(cars5) plot(cars6)
Show more
Read less
Institution
Big Data Tools & Architecture
Course
Big Data Tools & Architecture
Whoops! We can’t load your doc right now. Try again or contact support.
Connected book
Written for
- Institution
- Big Data Tools & Architecture
- Course
- Big Data Tools & Architecture
Document information
- Summarized whole book?
- No
- Which chapters are summarized?
- Unknown
- Uploaded on
- July 15, 2023
- File latest updated on
- February 22, 2024
- Number of pages
- 2
- Written in
- 2022/2023
- Type
- SUMMARY
Subjects
$10.99
Get access to the full document:
Wrong document? Swap it for free
Within 14 days of purchase and before downloading, you can choose a different document. You can simply spend the amount again.
Written by students who passed
Immediately available after payment
Read online or as PDF