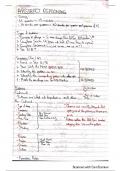
cooperating and integrating the information flows is important in a supply chain, that way
they can optimize the value companies offer —> they create a value chain
in an effective supply chain, they want to maximize the stages to maximize supply chain
surplus: customer value - supply chain cost
logistics: the part of the supply chain process that plans, implements, and controls the
efficient and effective flow and storage of goods and services
Reader: Deterministic performance estimation
https://cupdf.com/document/deterministic-performance-estimation.html?page=12
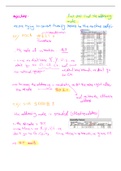
flow diagrams illustrate the movement of materials, information, or people through all
processes required to transform resources into products and services.
● blocks are used to represent a production or service process
● arrows can indicate the direction of the flow
to study the performance of the production system we need quantitative data, such as
interarrival times (time between two arrivals at the entrance, for example, 6 products with an
interval rate of 10 minutes equals an hour (arrival rate)) arrival times (how many products
arrived per time unit), production, and travel times.
production can be indicated by stochastic values (changes over time) and deterministic
values (constant).
there are other ways to illustrate the movement of people, or products through a system:
● time-function mapping: flow diagram in which the time is added on a horizontal axis
● process charts: analyzing the movement of people or material by using symbols,
time, and distance
● service blueprinting: used to focus on the customer and the interaction with the
customer
the throughput time can be defined as the time that passes between the moment at which
the product/consumer enters the system and the moment it is ready.
they can optimize the value companies offer —> they create a value chain
in an effective supply chain, they want to maximize the stages to maximize supply chain
surplus: customer value - supply chain cost
logistics: the part of the supply chain process that plans, implements, and controls the
efficient and effective flow and storage of goods and services
Reader: Deterministic performance estimation
https://cupdf.com/document/deterministic-performance-estimation.html?page=12
flow diagrams illustrate the movement of materials, information, or people through all
processes required to transform resources into products and services.
● blocks are used to represent a production or service process
● arrows can indicate the direction of the flow
to study the performance of the production system we need quantitative data, such as
interarrival times (time between two arrivals at the entrance, for example, 6 products with an
interval rate of 10 minutes equals an hour (arrival rate)) arrival times (how many products
arrived per time unit), production, and travel times.
production can be indicated by stochastic values (changes over time) and deterministic
values (constant).
there are other ways to illustrate the movement of people, or products through a system:
● time-function mapping: flow diagram in which the time is added on a horizontal axis
● process charts: analyzing the movement of people or material by using symbols,
time, and distance
● service blueprinting: used to focus on the customer and the interaction with the
customer
the throughput time can be defined as the time that passes between the moment at which
the product/consumer enters the system and the moment it is ready.