Visual_Analytics_Week3_Solved
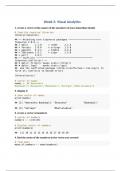
Follow the instructions in the book to create a new project. Give it a name and an author. Execute the 3 code snippets from the preface to bring all the packages into this new project then create a new R Markdown document as instructed by the book. Load the tidyverse and socviz libaries. In order to execute code in an R Markdown object, the code must be enclosed by: ```{r}.....``` Use R studio to complete the following: 1. create a vector of the names of the members of your immediate family 2. display it 3. create a vector of numbers 4. find the mean of the numbers in the vector you created 5. assign the results of a function to an object 6. display the object 7. determine the class of the vector 8. change the class of the vector to character 9. show the new class 10. show the titanic dataframe 11. show the class of titanic 12. convert the titanic dataframe to a tibble 13. show the structure of various objects 14. show the structure of the mpg dataframe (mpg is an example dataset showing mileage for cars of various models and with different numbers of cylinders) 15. show the contents of the mpg dataframe 16. create a scatterplot of the mpg dataset 17. create an object called 'url' with the organ donation file in it 18. create an object with the organ donation data, find the structure of that object, load the gapminder dataset (watch this video to learn more about gapminder) 19. make a scatterplot of the gdpPercap and lifeexp
Connected book
Written for
- Institution
- Visual Analytics
- Course
- Visual Analytics
Document information
- Uploaded on
- April 4, 2023
- File latest updated on
- July 11, 2023
- Number of pages
- 9
- Written in
- 2022/2023
- Type
- Exam (elaborations)
- Contains
- Questions & answers
Subjects
-
visualanalyticsweek3solved
Also available in package deal