D2
In this presentation I am going to evaluate the financial performanc
Greckos business. I will evaluate the performance in profitability
liquidity and efficiency over the two years. These are the ratios and
answers to for Grecko in the years of 2011 and 2012.
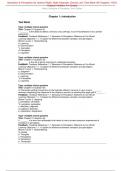
Ratios Grecko Workings Grecko 201
2011
Current Ratio 2.46: 1 Current assets 1.1:1
Current liabilities
Acid Test 1.92:1 Liquid assets 0.54:1
Current liabilities
Gross profit margin 54.13% Gross profit 60.6%
Sales x 100
Net profit margin 31.24% Net profit 27.79%
Sales x 100
Return on capital 25.13% Net profit 27.09%
Capital employed x 100
Creditor payment days 168 Days Creditors 276 Days
Cost of sales x 365
Debtor days 65 Days Debtors 63 Days
Sales x 365
Stock turnover 6 ( 61 Days) Average stock 3.11 (118
Cost of sales x 365 days)
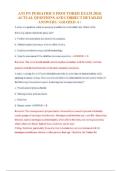
, Gross profit Margin
The first profitability ratio I will discussing is the gross profit margin ratio. Gross profit margin is a pr
ratio that measures how much of every dollar of revenues is left over after paying cost of goods sold
ratio you take the sales and divide it by the gross profit and then x the answer by 100 so it comes o
percentage. So for Grecko dividing the sales (301, 564) and dividing it by the gross profit (182, 719)
100 will give you the answer of 60.6%. Therefore this means that for every 1 pound of sales there is
of gross profit made. This is very good for the business because they are making profit which is mos
businesses main objective.
2011 2012
54.13% 60.6%
In this presentation I am going to evaluate the financial performanc
Greckos business. I will evaluate the performance in profitability
liquidity and efficiency over the two years. These are the ratios and
answers to for Grecko in the years of 2011 and 2012.
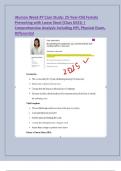
Ratios Grecko Workings Grecko 201
2011
Current Ratio 2.46: 1 Current assets 1.1:1
Current liabilities
Acid Test 1.92:1 Liquid assets 0.54:1
Current liabilities
Gross profit margin 54.13% Gross profit 60.6%
Sales x 100
Net profit margin 31.24% Net profit 27.79%
Sales x 100
Return on capital 25.13% Net profit 27.09%
Capital employed x 100
Creditor payment days 168 Days Creditors 276 Days
Cost of sales x 365
Debtor days 65 Days Debtors 63 Days
Sales x 365
Stock turnover 6 ( 61 Days) Average stock 3.11 (118
Cost of sales x 365 days)
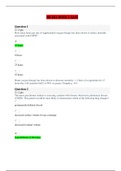
, Gross profit Margin
The first profitability ratio I will discussing is the gross profit margin ratio. Gross profit margin is a pr
ratio that measures how much of every dollar of revenues is left over after paying cost of goods sold
ratio you take the sales and divide it by the gross profit and then x the answer by 100 so it comes o
percentage. So for Grecko dividing the sales (301, 564) and dividing it by the gross profit (182, 719)
100 will give you the answer of 60.6%. Therefore this means that for every 1 pound of sales there is
of gross profit made. This is very good for the business because they are making profit which is mos
businesses main objective.
2011 2012
54.13% 60.6%