

Enzymes and Nucleic Acids Workbook Name
Enzymes
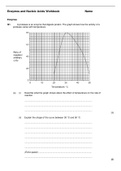
Q1. A protease is an enzyme that digests protein. The graph shows how the activity of a
protease varies with temperature.
(a) (i) Describe what the graph shows about the effect of temperature on the rate of
reaction.
.............................................................................................................
.............................................................................................................
.............................................................................................................
(1)
(ii) Explain the shape of the curve between 30 °C and 50 °C.
.............................................................................................................
.............................................................................................................
.............................................................................................................
.............................................................................................................
.............................................................................................................
.............................................................................................................
(Extra space) ......................................................................................
.............................................................................................................
(3)
, (b) Students investigated the effect of pH on the activity of the protease.
• The students used agar plates containing protein. The protein made the agar
cloudy.
• They made four wells of equal size in the agar of each plate.
• They added a drop of protease solution to each of the wells. The protease solution
in each well was at a different pH.
• The students incubated the agar plates for 4 hours at a constant temperature.
The diagram shows the agar plates after they were incubated and the pH of the protease
solution in each well.
(i) How should the students make sure that the pH of the protease solution did not
change?
.............................................................................................................
(1)
(ii) Use the graph to suggest a suitable temperature for incubating the agar plates.
Explain your answer.
.............................................................................................................
.............................................................................................................
.............................................................................................................
(1)
(iii) Use the diagram to describe the effect of pH on the activity of this protease.
.............................................................................................................
.............................................................................................................
.............................................................................................................
(1)
(Total 7 marks)
Q2. The equation shows the breakdown of lactose by the enzyme lactase.
, Lactose + water galactose + monosaccharide X
(a) (i) Name the type of reaction catalysed by the enzyme lactase.
.............................................................................................................
(1)
(ii) Name monosaccharide X.
.............................................................................................................
(1)
(b) (i) Describe how you would use a biochemical test to show that a reducing sugar is
present.
.............................................................................................................
.............................................................................................................
.............................................................................................................
.............................................................................................................
.............................................................................................................
(2)
(ii) Lactose, galactose and monosaccharide X are all reducing sugars.
After the lactose has been broken down there is a higher concentration of reducing
sugar. Explain why.
.............................................................................................................
(1)
(c) A high concentration of galactose slows down the breakdown of lactose by lactase.
Use your knowledge of competitive inhibition to suggest why.
......................................................................................................................
......................................................................................................................
......................................................................................................................
......................................................................................................................
......................................................................................................................
(2)
(Total 7 marks)
Q3.(a) Describe the induced-fit model of enzyme action.
.............................................................................................................................
.............................................................................................................................
.............................................................................................................................
.............................................................................................................................
.............................................................................................................................(2)
(b) A scientist investigated the hydrolysis of starch.He added amylase to a suspension of
starch and measured the concentration of maltose in the reaction mixture at regular
Enzymes
Q1. A protease is an enzyme that digests protein. The graph shows how the activity of a
protease varies with temperature.
(a) (i) Describe what the graph shows about the effect of temperature on the rate of
reaction.
.............................................................................................................
.............................................................................................................
.............................................................................................................
(1)
(ii) Explain the shape of the curve between 30 °C and 50 °C.
.............................................................................................................
.............................................................................................................
.............................................................................................................
.............................................................................................................
.............................................................................................................
.............................................................................................................
(Extra space) ......................................................................................
.............................................................................................................
(3)
, (b) Students investigated the effect of pH on the activity of the protease.
• The students used agar plates containing protein. The protein made the agar
cloudy.
• They made four wells of equal size in the agar of each plate.
• They added a drop of protease solution to each of the wells. The protease solution
in each well was at a different pH.
• The students incubated the agar plates for 4 hours at a constant temperature.
The diagram shows the agar plates after they were incubated and the pH of the protease
solution in each well.
(i) How should the students make sure that the pH of the protease solution did not
change?
.............................................................................................................
(1)
(ii) Use the graph to suggest a suitable temperature for incubating the agar plates.
Explain your answer.
.............................................................................................................
.............................................................................................................
.............................................................................................................
(1)
(iii) Use the diagram to describe the effect of pH on the activity of this protease.
.............................................................................................................
.............................................................................................................
.............................................................................................................
(1)
(Total 7 marks)
Q2. The equation shows the breakdown of lactose by the enzyme lactase.
, Lactose + water galactose + monosaccharide X
(a) (i) Name the type of reaction catalysed by the enzyme lactase.
.............................................................................................................
(1)
(ii) Name monosaccharide X.
.............................................................................................................
(1)
(b) (i) Describe how you would use a biochemical test to show that a reducing sugar is
present.
.............................................................................................................
.............................................................................................................
.............................................................................................................
.............................................................................................................
.............................................................................................................
(2)
(ii) Lactose, galactose and monosaccharide X are all reducing sugars.
After the lactose has been broken down there is a higher concentration of reducing
sugar. Explain why.
.............................................................................................................
(1)
(c) A high concentration of galactose slows down the breakdown of lactose by lactase.
Use your knowledge of competitive inhibition to suggest why.
......................................................................................................................
......................................................................................................................
......................................................................................................................
......................................................................................................................
......................................................................................................................
(2)
(Total 7 marks)
Q3.(a) Describe the induced-fit model of enzyme action.
.............................................................................................................................
.............................................................................................................................
.............................................................................................................................
.............................................................................................................................
.............................................................................................................................(2)
(b) A scientist investigated the hydrolysis of starch.He added amylase to a suspension of
starch and measured the concentration of maltose in the reaction mixture at regular


