ECON210.JacobIrwin.Module2Assignment. scored 98%
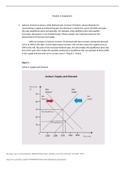
1. Joshua’s income increases, while federal taxes increase; therefore, please illustrate by constructing a supply and demand graph, the direction in which the curves will shift and state the new equilibrium price and quantity; for example, state whether price and quantity increased, decreased, or are indeterminate. Please explain your rationale based on the determinants of demand and supply. With an increase in Joshua’s income, his demand will also increase causing the demand curve to shift to the right. As the federal taxes increase, this will also cause the supply curve to shift to the left. Because of the increased federal taxes, this also makes the equilibrium price rise but at the same time makes the quantity produced at equilibrium fall. An example of these shifts in the supply and demand curve can bee seen in “Figure 1” below.
Written for
- Institution
-
Embry-Riddle Aeronautical University
- Course
-
ECON ECON 210
Document information
- Uploaded on
- August 18, 2022
- Number of pages
- 5
- Written in
- 2022/2023
- Type
- OTHER
- Person
- Unknown
Subjects
-
assignment
-
module2assignment
-
econ210jacobirwin
Also available in package deal