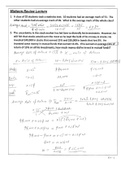
“STATISTICS”
SCATTER PLOTS
LEAST SQUARES REGRESSION LINE
CORRELATION COEFFICIENT
THE LAST PAYMENT
SINKING FUND
The questions normally consist of three parts:
1. Draw a scatter plot.
2. Determine the equation of the least squares regression line and draw
the line of best fit.
3. Determine the correlation coefficient and comment on it.
, SCATTER PLOT
When we conduct a study on the relationship between two types of data we are
working with bivariate data (two sets of data values that both vary). It is very
useful to display the bivariate data in graphical form. This is called a scatter plot.
Scatterplots are useful diagrams that enable researchers to compare two sets
of data to determine whether there is a relationship (correlation) between them.
Plotting this data on a scatterplot diagram will show trends in the data. Data
could follow a linear, quadratic or exponential trend