

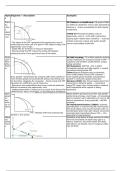
Topic Diagrams + description Examples
s
Scarc UK Defence vs healthcare: UK spent £59bn
ity, on defence (2024/25); every £1bn allocated to
choic defence is ~£1bn unavailable for NHS capital
e, investment
oppor
tunity COVID-19 Choosing lockdown had an
cost opportunity cost of ~10% GDP contraction;
staying open risked mass mortality — scarcity
of both economic output and public health
- The slope of the PPF represents the opportunity cost of
forced unavoidable trade-offs
producing one more unit of a good. If the slope is steep, the
opportunity cost is high.
- Trade-offs are inherent in resource allocation.
- Moving along the PPF shows the trade-off between
producing more of one good and less of the other.
Produ UK NHS backlog: 7.6 million patients waiting
ction (2023) represent an economy inside its PPF —
Possi surgeons and theatres underutilised, output
bility below potential
Fronti UK Recession: GDP fell ~6% in 2020;
er furloughed workers and idle capital = inward
movement along/inside PPF
China Massive infrastructure investment
since 2000 shifted China's PPF outward —
Econ growth- represented by outward shift which allows for more capital goods enabled simultaneous
more of both goods to be produced without sacrificing one growth in consumer goods production
for the other. Opposite for recession. - Points inside the PPF Ukraine (2022) War forced reallocation from
represent an inefficient use of resources. consumer to defence goods — movement
- Resources are underutilized and more could be produced along PPF away from civilian output; outward
without increasing the opportunity cost. shift impossible while capital is being
- Underemployment of resources can result from factors like destroyed
inefficiencies, labour shortages, or technological limitations.
Speci Adam Smith's pin factory (1776): one worker
alisati performing all steps could make ~20 pins/day;
on with 10 workers each specialising in one of 18
and distinct operations, they produced ~48,000
divisi pins/day.
on of UK Deindustrialisation (1980s): extreme
labou specialisation in coal mining left communities
r like South Wales and County Durham with no
transferable skills when pits closed; structural
Skewed shift from productivity unemployment persisted above 12% — the
growth in one sector downside of specialisation
Margi Someone may derive a large amount of utility
nal from the first bottle of water they get in a
Utility desert; however, the tenth bottle will likely
Theor add little to no benefit, hence marginal utility
y has declined
,Cons UK Energy price cap (Ofgem): without the
umer cap during the 2022 spike, consumer surplus
and would have been massively reduced; the cap
produ effectively transferred surplus from energy
cer producers back to households
surpl CS Ticketmaster: 70–80% market share in
us US ticketing; charges above-competitive
prices → large CS transferred to producer
surplus + DWL from under-consumption of live
events at competitive prices
UK Sugar levy (2018): tax shifted supply
curve up, raising price and reducing CS —
CS = area below demand, above price; PS = area above welfare loss judged acceptable given the
supply, below price; total welfare = CS + PS; deadweight negative externality being corrected
loss (DWL) = welfare destroyed by monopoly/tax/price THEORY Monopoly creates DWL by restricting
controls; price discrimination transfers CS to PS output below the socially optimal level; units
between Qm and Qc are valued by consumers
above their marginal cost of production but
are not produced
Shifts Substitutes Substitutes Coke vs Pepsi: rise in Coke price
in → demand for Pepsi shifts right; positive cross-
Dema price elasticity
nd Joint (complements) Razors and razor
blades: Gillette sells razors cheaply knowing
demand for high-margin blades is derived
from razor ownership — loss-leader strategy
built on joint demand
Composite Land: increased housing demand
competes with agricultural and commercial
uses — one demand shifts supply available to
others
Derived Demand for lithium derived from EV
battery demand; UK's 2035 ICE ban shifts
Joint Demand lithium demand right regardless of lithium's
own price
UK COVID lockdowns: demand for restaurant
meals collapsed; demand for Deliveroo surged
— taste/circumstance shift with no price
change
UK Lidl/Aldi: during cost-of-living crisis (2022–
23) demand for discount supermarkets rose
sharply as real incomes fell — inferior good
behaviour for some consumers
Composite
Derived demand
, Shifts Normal shift, Joint supply USA Shale gas revolution (2010–
in 18): fracking technology shifted US natural
Suppl gas supply dramatically right, cutting prices
y ~70% — technology-driven supply shift
Joint supply Beef and leather are joint
products; an increase in beef demand raises
the supply of hides, pushing leather prices
down — cannot produce one without the other
UK (2026) Iran War: UK wholesale gas prices
↑75% (Feb–March 2026) → supply of energy-
intensive goods (fertilisers, chemicals,
aluminium) shifts left — input cost shock
UK Sustainable Farming Incentive (SFI):
subsidy reduces effective production costs for
qualifying farmers → supply of sustainably-
farmed food shifts right
Exces UK Housing — persistent excess
s demand: supply structurally constrained (PES
dema ≈ 0.14); price rises continuously rather than
nd clearing via new supply; planning system
prevents market from self-correcting
Also show movement along, showing functions of price
Exces UK Used car market (2023–
s 24): semiconductor shortage eased, new car
suppl supply recovered → used car prices fell ~15%
y from 2022 peak as excess supply emerged —
textbook price adjustment
EU Butter mountains / wine lakes (1970s–
80s): minimum guaranteed prices to farmers
created persistent excess supply — 1.7 million
tonnes surplus butter stored at EU expense;
government intervention preventing market
clearing
s
Scarc UK Defence vs healthcare: UK spent £59bn
ity, on defence (2024/25); every £1bn allocated to
choic defence is ~£1bn unavailable for NHS capital
e, investment
oppor
tunity COVID-19 Choosing lockdown had an
cost opportunity cost of ~10% GDP contraction;
staying open risked mass mortality — scarcity
of both economic output and public health
- The slope of the PPF represents the opportunity cost of
forced unavoidable trade-offs
producing one more unit of a good. If the slope is steep, the
opportunity cost is high.
- Trade-offs are inherent in resource allocation.
- Moving along the PPF shows the trade-off between
producing more of one good and less of the other.
Produ UK NHS backlog: 7.6 million patients waiting
ction (2023) represent an economy inside its PPF —
Possi surgeons and theatres underutilised, output
bility below potential
Fronti UK Recession: GDP fell ~6% in 2020;
er furloughed workers and idle capital = inward
movement along/inside PPF
China Massive infrastructure investment
since 2000 shifted China's PPF outward —
Econ growth- represented by outward shift which allows for more capital goods enabled simultaneous
more of both goods to be produced without sacrificing one growth in consumer goods production
for the other. Opposite for recession. - Points inside the PPF Ukraine (2022) War forced reallocation from
represent an inefficient use of resources. consumer to defence goods — movement
- Resources are underutilized and more could be produced along PPF away from civilian output; outward
without increasing the opportunity cost. shift impossible while capital is being
- Underemployment of resources can result from factors like destroyed
inefficiencies, labour shortages, or technological limitations.
Speci Adam Smith's pin factory (1776): one worker
alisati performing all steps could make ~20 pins/day;
on with 10 workers each specialising in one of 18
and distinct operations, they produced ~48,000
divisi pins/day.
on of UK Deindustrialisation (1980s): extreme
labou specialisation in coal mining left communities
r like South Wales and County Durham with no
transferable skills when pits closed; structural
Skewed shift from productivity unemployment persisted above 12% — the
growth in one sector downside of specialisation
Margi Someone may derive a large amount of utility
nal from the first bottle of water they get in a
Utility desert; however, the tenth bottle will likely
Theor add little to no benefit, hence marginal utility
y has declined
,Cons UK Energy price cap (Ofgem): without the
umer cap during the 2022 spike, consumer surplus
and would have been massively reduced; the cap
produ effectively transferred surplus from energy
cer producers back to households
surpl CS Ticketmaster: 70–80% market share in
us US ticketing; charges above-competitive
prices → large CS transferred to producer
surplus + DWL from under-consumption of live
events at competitive prices
UK Sugar levy (2018): tax shifted supply
curve up, raising price and reducing CS —
CS = area below demand, above price; PS = area above welfare loss judged acceptable given the
supply, below price; total welfare = CS + PS; deadweight negative externality being corrected
loss (DWL) = welfare destroyed by monopoly/tax/price THEORY Monopoly creates DWL by restricting
controls; price discrimination transfers CS to PS output below the socially optimal level; units
between Qm and Qc are valued by consumers
above their marginal cost of production but
are not produced
Shifts Substitutes Substitutes Coke vs Pepsi: rise in Coke price
in → demand for Pepsi shifts right; positive cross-
Dema price elasticity
nd Joint (complements) Razors and razor
blades: Gillette sells razors cheaply knowing
demand for high-margin blades is derived
from razor ownership — loss-leader strategy
built on joint demand
Composite Land: increased housing demand
competes with agricultural and commercial
uses — one demand shifts supply available to
others
Derived Demand for lithium derived from EV
battery demand; UK's 2035 ICE ban shifts
Joint Demand lithium demand right regardless of lithium's
own price
UK COVID lockdowns: demand for restaurant
meals collapsed; demand for Deliveroo surged
— taste/circumstance shift with no price
change
UK Lidl/Aldi: during cost-of-living crisis (2022–
23) demand for discount supermarkets rose
sharply as real incomes fell — inferior good
behaviour for some consumers
Composite
Derived demand
, Shifts Normal shift, Joint supply USA Shale gas revolution (2010–
in 18): fracking technology shifted US natural
Suppl gas supply dramatically right, cutting prices
y ~70% — technology-driven supply shift
Joint supply Beef and leather are joint
products; an increase in beef demand raises
the supply of hides, pushing leather prices
down — cannot produce one without the other
UK (2026) Iran War: UK wholesale gas prices
↑75% (Feb–March 2026) → supply of energy-
intensive goods (fertilisers, chemicals,
aluminium) shifts left — input cost shock
UK Sustainable Farming Incentive (SFI):
subsidy reduces effective production costs for
qualifying farmers → supply of sustainably-
farmed food shifts right
Exces UK Housing — persistent excess
s demand: supply structurally constrained (PES
dema ≈ 0.14); price rises continuously rather than
nd clearing via new supply; planning system
prevents market from self-correcting
Also show movement along, showing functions of price
Exces UK Used car market (2023–
s 24): semiconductor shortage eased, new car
suppl supply recovered → used car prices fell ~15%
y from 2022 peak as excess supply emerged —
textbook price adjustment
EU Butter mountains / wine lakes (1970s–
80s): minimum guaranteed prices to farmers
created persistent excess supply — 1.7 million
tonnes surplus butter stored at EU expense;
government intervention preventing market
clearing


