

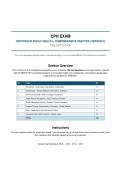
CPH EXAM
CERTIFIED IN PUBLIC HEALTH - COMPREHENSIVE PRACTICE (VERSION 2)
2026/2027 EDITION
This is an independent practice exam for educational study; it is not an official NBPHE CPH certification examination.
Section Overview
This is Version 2 of the comprehensive practice exam. It contains 100 new questions across eight sections, aligned
with the NBPHE CPH examination blueprint, current public health core competencies, and evidence-based public
health practice standards for 2026/2027.
Sec Topic Qs
1 Biostatistics - Study Design, Data Analysis, Interpretation 15
2 Epidemiology - Disease Distribution, Risk Factors, Outbreaks 15
3 Environmental Health - Risks, Toxicology, Assessment 10
4 Health Policy & Management - Policy, Planning, Evaluation 15
5 Social & Behavioral Sciences - Theories, Cultural Competency 15
6 Program Planning, Implementation & Evaluation - Models, Methods 10
7 Ethics, Leadership, & Interprofessional Practice 10
8 Integrated Public Health Scenarios - Complex Cases 10
TOTAL 100
Instructions
For each question, select the single best answer. Use the answer key at the end of the exam to check your work. Each
item includes a brief rationale explaining the correct response.
Answer Key Distribution: 25 A · 25 B · 25 C · 25 D
, Section 1: Biostatistics - Study Design, Data Analysis, and Interpretation
Q1: The mode of the data set 3, 5, 5, 7, 9 is:
A. 3
B. 7
C. 5 [CORRECT]
D. 9
Correct Answer: C
Rationale: The mode is the most frequent value, which is 5. The other options are not the mode.
Q2: The range of the data set 2, 4, 8, 12, 20 is:
A. 20
B. 12
C. 18 [CORRECT]
D. 8
Correct Answer: C
Rationale: The range = highest - lowest = 20 - 2 = 18. The other options are incorrect.
Q3: A 95% confidence interval for a mean that is wide indicates:
A. Greater uncertainty in the estimate [CORRECT]
B. More precision
C. Certainty
D. A significant result always
Correct Answer: A
Rationale: A wider CI indicates more uncertainty/less precision. The other options are incorrect.
Q4: Which statistical test would be used to compare the means of two independent groups?
A. Chi-square test
B. ANOVA for two groups
C. Independent t-test [CORRECT]
D. Correlation
Correct Answer: C
Rationale: An independent t-test compares means of two independent groups. Chi-square tests associations, ANOVA compares
three+ groups.
Q5: The chi-square test is used to:
A. Compare means
B. Measure correlation
C. Compute incidence
D. Test associations between categorical variables [CORRECT]
Correct Answer: D
Rationale: Chi-square tests associations between categorical variables. The other options use different tests.
Q6: A p-value represents:
A. The probability the null is true
B. The effect size
C. The probability of observing the data (or more extreme) if the null hypothesis is true [CORRECT]
D. The sample size
Correct Answer: C
Rationale: The p-value is the probability of the data if the null is true. The other options misstate it.
Q7: Increasing the sample size generally:
A. Increases statistical power and precision [CORRECT]
B. Decreases power
CPH Exam - Certified in Public Health - v2 - 2026/2027 Page 2
, C. Has no effect
D. Increases bias
Correct Answer: A
Rationale: Larger samples increase power and precision. The other options are incorrect.
Q8: Bias in a study refers to:
A. Random variation
B. A correct result
C. A large sample
D. Systematic error that distorts results [CORRECT]
Correct Answer: D
Rationale: Bias is systematic error that distorts results. The other options are incorrect.
Q9: A correlation coefficient (r) of +1.0 indicates:
A. No relationship
B. A perfect negative relationship
C. A perfect positive linear relationship [CORRECT]
D. Causation
Correct Answer: C
Rationale: An r of +1.0 is a perfect positive linear relationship. The other options are incorrect.
Q10: A correlation coefficient of 0 indicates:
A. A perfect relationship
B. No linear relationship [CORRECT]
C. A negative relationship
D. Causation
Correct Answer: B
Rationale: An r of 0 indicates no linear relationship. The other options are incorrect.
Q11: The standard error of the mean decreases as:
A. The sample size decreases
B. The sample size increases [CORRECT]
C. The variance increases
D. The mean increases
Correct Answer: B
Rationale: The standard error decreases as sample size increases. The other options are incorrect.
Q12: Which measure describes the variability of sample means around the population mean?
A. The mean
B. The median
C. The mode
D. The standard error [CORRECT]
Correct Answer: D
Rationale: The standard error measures variability of sample means. The other options are incorrect.
Q13: A study that observes participants without intervening is an:
A. Randomized controlled trial
B. Experimental study
C. Interventional trial
D. Observational study [CORRECT]
Correct Answer: D
Rationale: An observational study observes without intervening. The other options involve intervention.
Q14: The difference between an experimental and observational study is that experimental studies:
A. Involve researcher-controlled interventions [CORRECT]
CPH Exam - Certified in Public Health - v2 - 2026/2027 Page 3
CERTIFIED IN PUBLIC HEALTH - COMPREHENSIVE PRACTICE (VERSION 2)
2026/2027 EDITION
This is an independent practice exam for educational study; it is not an official NBPHE CPH certification examination.
Section Overview
This is Version 2 of the comprehensive practice exam. It contains 100 new questions across eight sections, aligned
with the NBPHE CPH examination blueprint, current public health core competencies, and evidence-based public
health practice standards for 2026/2027.
Sec Topic Qs
1 Biostatistics - Study Design, Data Analysis, Interpretation 15
2 Epidemiology - Disease Distribution, Risk Factors, Outbreaks 15
3 Environmental Health - Risks, Toxicology, Assessment 10
4 Health Policy & Management - Policy, Planning, Evaluation 15
5 Social & Behavioral Sciences - Theories, Cultural Competency 15
6 Program Planning, Implementation & Evaluation - Models, Methods 10
7 Ethics, Leadership, & Interprofessional Practice 10
8 Integrated Public Health Scenarios - Complex Cases 10
TOTAL 100
Instructions
For each question, select the single best answer. Use the answer key at the end of the exam to check your work. Each
item includes a brief rationale explaining the correct response.
Answer Key Distribution: 25 A · 25 B · 25 C · 25 D
, Section 1: Biostatistics - Study Design, Data Analysis, and Interpretation
Q1: The mode of the data set 3, 5, 5, 7, 9 is:
A. 3
B. 7
C. 5 [CORRECT]
D. 9
Correct Answer: C
Rationale: The mode is the most frequent value, which is 5. The other options are not the mode.
Q2: The range of the data set 2, 4, 8, 12, 20 is:
A. 20
B. 12
C. 18 [CORRECT]
D. 8
Correct Answer: C
Rationale: The range = highest - lowest = 20 - 2 = 18. The other options are incorrect.
Q3: A 95% confidence interval for a mean that is wide indicates:
A. Greater uncertainty in the estimate [CORRECT]
B. More precision
C. Certainty
D. A significant result always
Correct Answer: A
Rationale: A wider CI indicates more uncertainty/less precision. The other options are incorrect.
Q4: Which statistical test would be used to compare the means of two independent groups?
A. Chi-square test
B. ANOVA for two groups
C. Independent t-test [CORRECT]
D. Correlation
Correct Answer: C
Rationale: An independent t-test compares means of two independent groups. Chi-square tests associations, ANOVA compares
three+ groups.
Q5: The chi-square test is used to:
A. Compare means
B. Measure correlation
C. Compute incidence
D. Test associations between categorical variables [CORRECT]
Correct Answer: D
Rationale: Chi-square tests associations between categorical variables. The other options use different tests.
Q6: A p-value represents:
A. The probability the null is true
B. The effect size
C. The probability of observing the data (or more extreme) if the null hypothesis is true [CORRECT]
D. The sample size
Correct Answer: C
Rationale: The p-value is the probability of the data if the null is true. The other options misstate it.
Q7: Increasing the sample size generally:
A. Increases statistical power and precision [CORRECT]
B. Decreases power
CPH Exam - Certified in Public Health - v2 - 2026/2027 Page 2
, C. Has no effect
D. Increases bias
Correct Answer: A
Rationale: Larger samples increase power and precision. The other options are incorrect.
Q8: Bias in a study refers to:
A. Random variation
B. A correct result
C. A large sample
D. Systematic error that distorts results [CORRECT]
Correct Answer: D
Rationale: Bias is systematic error that distorts results. The other options are incorrect.
Q9: A correlation coefficient (r) of +1.0 indicates:
A. No relationship
B. A perfect negative relationship
C. A perfect positive linear relationship [CORRECT]
D. Causation
Correct Answer: C
Rationale: An r of +1.0 is a perfect positive linear relationship. The other options are incorrect.
Q10: A correlation coefficient of 0 indicates:
A. A perfect relationship
B. No linear relationship [CORRECT]
C. A negative relationship
D. Causation
Correct Answer: B
Rationale: An r of 0 indicates no linear relationship. The other options are incorrect.
Q11: The standard error of the mean decreases as:
A. The sample size decreases
B. The sample size increases [CORRECT]
C. The variance increases
D. The mean increases
Correct Answer: B
Rationale: The standard error decreases as sample size increases. The other options are incorrect.
Q12: Which measure describes the variability of sample means around the population mean?
A. The mean
B. The median
C. The mode
D. The standard error [CORRECT]
Correct Answer: D
Rationale: The standard error measures variability of sample means. The other options are incorrect.
Q13: A study that observes participants without intervening is an:
A. Randomized controlled trial
B. Experimental study
C. Interventional trial
D. Observational study [CORRECT]
Correct Answer: D
Rationale: An observational study observes without intervening. The other options involve intervention.
Q14: The difference between an experimental and observational study is that experimental studies:
A. Involve researcher-controlled interventions [CORRECT]
CPH Exam - Certified in Public Health - v2 - 2026/2027 Page 3


