

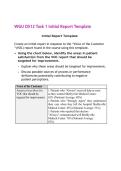
WGU D512 Task 1 Initial Report Template
Initial Report Template
Create an initial report in response to the “Voice of the Customer
“(VOC) report found in the course using this template.
• Using the chart below, identify the areas in patient
satisfaction from the VOC report that should be
targeted for improvement.
• Explain why these areas should be targeted for improvement.
• Discuss possible sources of process or performance
deficiencies potentially contributing to negative
patient perceptions.
Voice of the Customer
Areas (at least three) in 1. Patients who "Always" received help as soon
VOC that should be as they wanted Shelbyville Medical Center:
targeted for improvement 62% (National Average: 68%)
2. Patients who "Strongly Agree" they understood
their care when they left the hospital Shelbyville
Medical Center: 45% (National Average: 51%)
3. Patients who reported that doctors
"Always" communicated well Shelbyville
Medical Center: 76% (National Average:
82%)
, Rationale for selecting -Rationale for Area 1
each of these areas Timely assistance is essential for patient safety,
comfort, and satisfaction. A 6% gap compared to
the national average suggests inefficiencies in
service delivery.
-Rationale for Area 2
Understanding care post-hospitalization is key to
recovery and reduces the risk of readmission (Raja
Mohamed et al., 2021). A 6% gap indicates a need
for better communication and more thorough
discharge planning.
-Rationale for Area 3
Effective communication between doctors and
patients is crucial for trust, patient adherence, and
treatment outcomes. The 6% difference from the
national average indicates that improving
interactions between doctors and patients is
necessary.
Discussion of deficiencies -For Area 1 (Receiving Help)
Deficiencies likely stem from workflow
inefficiencies, delays in staff response times, or
staffing shortages. A review of nurse-to-patient
ratios and patient communication processes may
help.
-For Area 2 (Understanding Care)
Inadequate discharge planning, limited
communication at the time of discharge, and poor
patient engagement may be
the root causes. Improving discharge protocols and
patient education may address these issues.
-For Area 3 (Doctor Communication)
The issue could be driven by time constraints, high
patient volumes, or a lack of emphasis on patient-
centered communication in doctor training.
Enhanced training and workflow improvements may
be needed.
• Process Flowchart. Construct a current-state process
flowchart that starts with a patient registering at triage and
ends with the patient receiving care from the attending
physician.
Initial Report Template
Create an initial report in response to the “Voice of the Customer
“(VOC) report found in the course using this template.
• Using the chart below, identify the areas in patient
satisfaction from the VOC report that should be
targeted for improvement.
• Explain why these areas should be targeted for improvement.
• Discuss possible sources of process or performance
deficiencies potentially contributing to negative
patient perceptions.
Voice of the Customer
Areas (at least three) in 1. Patients who "Always" received help as soon
VOC that should be as they wanted Shelbyville Medical Center:
targeted for improvement 62% (National Average: 68%)
2. Patients who "Strongly Agree" they understood
their care when they left the hospital Shelbyville
Medical Center: 45% (National Average: 51%)
3. Patients who reported that doctors
"Always" communicated well Shelbyville
Medical Center: 76% (National Average:
82%)
, Rationale for selecting -Rationale for Area 1
each of these areas Timely assistance is essential for patient safety,
comfort, and satisfaction. A 6% gap compared to
the national average suggests inefficiencies in
service delivery.
-Rationale for Area 2
Understanding care post-hospitalization is key to
recovery and reduces the risk of readmission (Raja
Mohamed et al., 2021). A 6% gap indicates a need
for better communication and more thorough
discharge planning.
-Rationale for Area 3
Effective communication between doctors and
patients is crucial for trust, patient adherence, and
treatment outcomes. The 6% difference from the
national average indicates that improving
interactions between doctors and patients is
necessary.
Discussion of deficiencies -For Area 1 (Receiving Help)
Deficiencies likely stem from workflow
inefficiencies, delays in staff response times, or
staffing shortages. A review of nurse-to-patient
ratios and patient communication processes may
help.
-For Area 2 (Understanding Care)
Inadequate discharge planning, limited
communication at the time of discharge, and poor
patient engagement may be
the root causes. Improving discharge protocols and
patient education may address these issues.
-For Area 3 (Doctor Communication)
The issue could be driven by time constraints, high
patient volumes, or a lack of emphasis on patient-
centered communication in doctor training.
Enhanced training and workflow improvements may
be needed.
• Process Flowchart. Construct a current-state process
flowchart that starts with a patient registering at triage and
ends with the patient receiving care from the attending
physician.


