

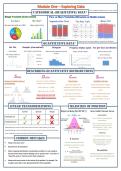
*Can be arranged into categories (e.g. hair color or genre).
Categorical (Qualitative) Data*
Single Variable (Univariate) Two or More Variables (Bivariate or Multivariate)
Pie Chart Bar Chart Segmented Bar Chart Two-Way Table Mosaic Plot
Best when data adds up to 100% Always a great choice
*Always have units. For example, height (in.) , age (years), or SAT (points).
Quantitative Data*
Dot Plot Stemplot (stem-and-leaf) Histogram Frequency Display (ogive) Box plot (box and whisker)
Quick display! Don’t forget to include the key! Make sure that everything is less than Always cumulative display Best for summary stats!
bin limit.
Don’t forget to label and Variations: Uses 5 # Summary
title the graph!
Back-to-back (Min, Q1, Med, Q3, Max)
Split stems:
0-4, 5-9
Describing Quantitative Distributions
Shape Outlier Center Spread
Always start with the shape of Be sure to use the 1.5IQR rule Typical Values Variability in the data
the distribution: in order to determine outliers.
Unless the shape of the Report the IQR (with median)
Symmetric Lower fence: Q1 - 1.5IQR distribution is symmetric use and Standard Deviation (with
median instead of the mean. mean).
Upper fence: Q3 + 1.5IQR
The mean is sensitive to Range and Standard Deviation
Skewed ( left or right ) Always show your work and
outliers, whereas the median is are sensitive to outliers,
round to four decimal places! resistant. whereas the IQR is resistant.
Linear Transformations Measures of Position
Center Spread Shape Empirical Rule (68-95-99.7) Area Under Normal Curve
NormalCDF()
Add/Subtract
From z-scores to percentage of
observations
Multiply/Divide
When stating Normalcdf, you must
state what each value represents
Adding/Subtracting a constant will only change measures of center (e.g. Mean, Median, Q1, Q3, Mode). Normalcdf(upper =, lower =, mean
= , standard deviation = )
Multiplying/Dividing by a constant will change measures of center and spread (e.g. Standard Deviation, IQR, Range).
Unless multiplying by a negative, the shape of the distribution will not change. InvNorm()
From Percentile to z-score.
Common mistakes Z-Scores When stating InvNorm, you must
state what each value represents
• Always show your work! Z-Scores: How many standard InvNorm(percentile= , mean = ,
deviations a data point is away standard deviation = )
• Round to four decimal places! from the mean.
• When comparing distributions of quantitative variables, it is not enough to Percentiles
list each of the values in SOCS. Wording such as “greater than”, “less than” or The pth percentile of a distribution is
“about the same as” must be used to show comparison. Having a negative z-score is not always a the value with p% of observations less
bad thing (e.g. golf and swimming). Always
than or equal to it.
• Always write your answers in the context of the problem. For example, The read and answer the question in context of
the problem!
Avengers were able to save approximately 50% of the population.
Categorical (Qualitative) Data*
Single Variable (Univariate) Two or More Variables (Bivariate or Multivariate)
Pie Chart Bar Chart Segmented Bar Chart Two-Way Table Mosaic Plot
Best when data adds up to 100% Always a great choice
*Always have units. For example, height (in.) , age (years), or SAT (points).
Quantitative Data*
Dot Plot Stemplot (stem-and-leaf) Histogram Frequency Display (ogive) Box plot (box and whisker)
Quick display! Don’t forget to include the key! Make sure that everything is less than Always cumulative display Best for summary stats!
bin limit.
Don’t forget to label and Variations: Uses 5 # Summary
title the graph!
Back-to-back (Min, Q1, Med, Q3, Max)
Split stems:
0-4, 5-9
Describing Quantitative Distributions
Shape Outlier Center Spread
Always start with the shape of Be sure to use the 1.5IQR rule Typical Values Variability in the data
the distribution: in order to determine outliers.
Unless the shape of the Report the IQR (with median)
Symmetric Lower fence: Q1 - 1.5IQR distribution is symmetric use and Standard Deviation (with
median instead of the mean. mean).
Upper fence: Q3 + 1.5IQR
The mean is sensitive to Range and Standard Deviation
Skewed ( left or right ) Always show your work and
outliers, whereas the median is are sensitive to outliers,
round to four decimal places! resistant. whereas the IQR is resistant.
Linear Transformations Measures of Position
Center Spread Shape Empirical Rule (68-95-99.7) Area Under Normal Curve
NormalCDF()
Add/Subtract
From z-scores to percentage of
observations
Multiply/Divide
When stating Normalcdf, you must
state what each value represents
Adding/Subtracting a constant will only change measures of center (e.g. Mean, Median, Q1, Q3, Mode). Normalcdf(upper =, lower =, mean
= , standard deviation = )
Multiplying/Dividing by a constant will change measures of center and spread (e.g. Standard Deviation, IQR, Range).
Unless multiplying by a negative, the shape of the distribution will not change. InvNorm()
From Percentile to z-score.
Common mistakes Z-Scores When stating InvNorm, you must
state what each value represents
• Always show your work! Z-Scores: How many standard InvNorm(percentile= , mean = ,
deviations a data point is away standard deviation = )
• Round to four decimal places! from the mean.
• When comparing distributions of quantitative variables, it is not enough to Percentiles
list each of the values in SOCS. Wording such as “greater than”, “less than” or The pth percentile of a distribution is
“about the same as” must be used to show comparison. Having a negative z-score is not always a the value with p% of observations less
bad thing (e.g. golf and swimming). Always
than or equal to it.
• Always write your answers in the context of the problem. For example, The read and answer the question in context of
the problem!
Avengers were able to save approximately 50% of the population.


