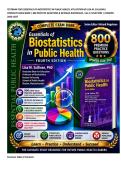
TESTBANK FOR ESSENTIALS OF BIOSTATISTICS IN PUBLIC HEALTH, 4TH EDITION BY LISA M. SULLIVAN |
COMPLETE EXAM BANK | 800 PRACTICE QUESTIONS & DETAILED RATIONALES | ALL 13 CHAPTERS | UPDATED
2026–2027
Premium Table of Contents
,Essentials of Biostatistics in Public Health, 4th Edition by Lisa M. Sullivan
Complete Exam Bank | 800 Practice Questions & Detailed Rationales | Updated 2026–2027
Chapter Question Range Chapter Title
Chapter 1 1–60 Introduction to Biostatistics and Public Health Research
Chapter 2 61–120 Study Designs in Public Health Research
Chapter 3 121–180 Quantifying the Extent of Disease and Measures of Health
Chapter 4 181–240 Summarizing and Presenting Data Collected in Samples
Chapter 5 241–300 Probability Concepts and Applications in Public Health
Chapter 6 301–360 Confidence Interval Estimation and Statistical Inference
Chapter 7 361–430 Hypothesis Testing Procedures and Interpretation
Chapter 8 431–490 Power Analysis and Sample Size Determination
Chapter 9 491–560 Comparing Two Groups and Statistical Comparisons
Chapter 10 561–620 Analysis of Variance (ANOVA) and Related Methods
Chapter 11 621–690 Correlation, Linear Regression, and Multivariable Analysis
Chapter 12 691–760 Logistic Regression and Advanced Modeling Techniques
Chapter 13 761–800 Survival Analysis, Data Visualization, and Special Topics in Biostatistics
Total Questions: 800
Format Includes: Multiple-choice questions, correct answers, detailed rationales, why-not explanations,
public health pearls, research insights, calculation-based items, interpretation scenarios, and graduate-level
MPH/CEPH review coverage.
Essentials of Biostatistics in Public Health, 4th Edition by Lisa M. Sullivan:Chapter 1: Introduction to
Biostatistics and Public Health Research
Question 1
A state public health agency plans to estimate the prevalence of hypertension among adults aged 18 years
and older. Investigators randomly select 3,000 adults from across the state and collect blood pressure
measurements. Which statement best identifies the population of interest?
A. The 3,000 adults selected for the survey
,B. Adults who were found to have hypertension
C. All adults aged 18 years and older residing in the state
D. Adults who completed every survey question
Correct Answer: C
Rationale: The population of interest is the entire group about which researchers want to draw conclusions. In
this study, the investigators seek to estimate hypertension prevalence among all adults aged 18 years and older
living in the state. The 3,000 individuals selected for participation constitute a sample drawn from that larger
population. Biostatistical methods are used to analyze sample data and estimate population parameters while
accounting for sampling variability. A clearly defined target population is essential because it determines the
scope of inference and influences study design, sampling strategies, and interpretation of findings. If the
sample is representative, investigators can generalize their results to the broader adult population of the state.
Why Not A: The 3,000 participants represent the sample rather than the population.
Why Not B: This group includes only participants with hypertension and does not represent all adults.
Why Not D: Individuals completing every survey question represent only a subset of participants.
Public Health Pearl: Population parameters are generally unknown and must be estimated from sample
statistics.
Research Insight: National surveys such as population health surveillance systems rely on representative
sampling to estimate disease prevalence.
Question 2
An investigator records participant sex as male, female, or another self-identified category. What type of
variable is being measured?
A. Continuous
B. Nominal
C. Ordinal
D. Ratio
Correct Answer: B
Rationale: This variable is nominal because it consists of categories that identify group membership without
implying a natural order or ranking. Nominal variables are common in public health research and are typically
summarized using frequencies, percentages, and contingency tables. Understanding variable types is critical
because statistical procedures depend on the scale of measurement. For example, means and standard
deviations are not appropriate summaries for nominal data. Instead, categorical analyses such as chi-square
tests are often used. Correctly classifying variables is one of the first steps in statistical analysis and helps
ensure valid conclusions.
Why Not A: Continuous variables can take infinitely many numerical values.
,Why Not C: Ordinal variables have categories with a meaningful order.
Why Not D: Ratio variables are numerical and possess a true zero point.
Public Health Pearl: Proper variable classification guides appropriate data analysis and interpretation.
Research Insight: Demographic variables are routinely collected in epidemiologic studies to describe study
populations and evaluate disparities.
Question 3
A researcher measures body mass index (BMI) for each participant in a community health study. BMI is best
classified as which type of variable?
A. Nominal
B. Binary
C. Continuous quantitative
D. Ordinal
Correct Answer: C
Rationale: Body mass index is a quantitative continuous variable because it can assume a wide range of
numerical values with meaningful decimal precision. Continuous variables provide more detailed information
than categorical variables and often increase statistical power. In public health research, BMI is frequently
analyzed as a continuous outcome to evaluate obesity trends, associations with disease risk, and effectiveness
of interventions. Because continuous variables contain substantial information, researchers often prefer
analyzing them in their original form unless categorization is clinically justified.
Why Not A: BMI is not a category-based variable.
Why Not B: BMI is not limited to two possible outcomes.
Why Not D: BMI values are measured numerically rather than ranked categories.
Public Health Pearl: Continuous variables often provide greater analytical flexibility than categorized variables.
Research Insight: BMI is one of the most commonly used indicators in population health surveillance.
Question 4
A public health researcher reports that the average systolic blood pressure among a sample of 500 adults is
126 mmHg. This value is an example of a:
A. Population parameter
B. Statistic
C. Sampling frame
D. Census measure
,Correct Answer: B
Rationale: A statistic is a numerical summary calculated from a sample. Because the mean blood pressure was
computed using data from 500 sampled adults rather than every adult in the population, the value represents a
statistic. Statistics are used to estimate unknown population parameters and form the foundation of inferential
biostatistics. Researchers rely on statistics to make evidence-based conclusions while recognizing that sample
estimates are subject to sampling variability.
Why Not A: Parameters describe entire populations.
Why Not C: A sampling frame is a list used to identify potential participants.
Why Not D: A census includes every member of a population.
Public Health Pearl: Sample statistics are the building blocks of statistical inference.
Research Insight: Many public health decisions are based on estimates derived from sample statistics rather
than complete population data.
Question 5
Which of the following best describes the primary purpose of biostatistics in public health research?
A. Eliminate all uncertainty from research findings
B. Replace epidemiologic investigation
C. Provide methods for collecting, analyzing, and interpreting health data
D. Guarantee that every study reaches statistically significant results
Correct Answer: C
Rationale: Biostatistics provides the scientific framework for transforming health data into meaningful
information that can support decision-making. It encompasses study design, data collection, data
management, statistical analysis, and interpretation of results. While biostatistics helps quantify uncertainty
and improve decision-making, it cannot eliminate uncertainty entirely. Statistical methods allow researchers to
evaluate evidence objectively and determine whether observed patterns likely reflect true population
phenomena or random variation. As a result, biostatistics is a cornerstone of evidence-based public health
practice.
Why Not A: Uncertainty can be reduced but never completely eliminated.
Why Not B: Biostatistics complements epidemiology rather than replacing it.
Why Not D: Statistical significance cannot be guaranteed.
Public Health Pearl: Biostatistics converts data into evidence that informs public health action.
Research Insight: Every major public health intervention relies on statistical evidence generated through
biostatistical methods.
,Question 6
A national health survey aims to estimate the prevalence of diabetes among adults in a country.
Investigators select 10,000 participants using a scientifically designed sampling strategy. Why is sampling
used instead of studying every adult in the country?
A. Sampling completely eliminates bias
B. Sampling is generally more feasible, less costly, and less time-consuming while still providing valid estimates
C. Sampling guarantees perfect accuracy
D. Sampling removes the need for statistical analysis
Correct Answer: B
Rationale: In most public health investigations, studying every individual in a population is impractical because
of financial, logistical, and time constraints. Sampling allows researchers to collect information from a
representative subset of the population and use statistical methods to estimate population characteristics.
When sampling is performed properly, valid and reliable conclusions can be drawn about the target population.
Although sampling introduces sampling variability, it remains the foundation of most epidemiologic and public
health research. Carefully selected samples often provide highly accurate estimates while requiring
substantially fewer resources than a complete census.
Why Not A: Sampling can reduce bias when properly designed but cannot completely eliminate it.
Why Not C: All estimates contain some uncertainty.
Why Not D: Statistical analysis remains essential when using sampled data.
Public Health Pearl: Most public health evidence originates from representative samples rather than entire
populations.
Research Insight: National surveys such as health and nutrition surveillance programs rely on complex
sampling designs to generate population estimates.
Question 7
A researcher records participants' educational attainment as elementary school, high school, bachelor's
degree, master's degree, or doctoral degree. This variable is best classified as:
A. Continuous
B. Nominal
C. Ordinal
D. Binary
Correct Answer: C
,Rationale: Educational attainment represents an ordinal variable because the categories possess a natural
ranking from lower to higher levels of education. However, the differences between categories are not
necessarily equal or measurable in a numerical sense. Ordinal variables occupy an important middle ground
between nominal and quantitative variables. Researchers frequently summarize ordinal variables using
frequencies, percentages, medians, or nonparametric statistical methods. Recognizing the ordinal nature of
educational attainment ensures that appropriate analytical techniques are selected and prevents misuse of
statistical procedures designed for continuous variables.
Why Not A: Educational attainment is not measured on a continuous numerical scale.
Why Not B: The categories possess a meaningful order.
Why Not D: There are more than two possible categories.
Public Health Pearl: Ordinal variables contain ranking information but not equal numerical spacing.
Research Insight: Educational attainment is frequently analyzed as a social determinant of health.
Question 8
An epidemiologist is interested in determining whether smoking is associated with lung cancer. Which
discipline primarily provides the methods for analyzing the resulting data and quantifying the strength of
evidence?
A. Anatomy
B. Biostatistics
C. Physiology
D. Pathology
Correct Answer: B
Rationale: Biostatistics provides the mathematical and analytical framework necessary for evaluating
associations between exposures and outcomes. Once data are collected, statistical methods help determine
whether observed relationships are likely due to chance or reflect true underlying associations. Biostatistics also
provides estimates of effect size, confidence intervals, measures of uncertainty, and hypothesis-testing
procedures. In public health research, biostatistics and epidemiology work together closely: epidemiology
focuses on study design and disease patterns, while biostatistics provides tools for analyzing and interpreting
findings.
Why Not A: Anatomy focuses on body structure.
Why Not C: Physiology examines body function.
Why Not D: Pathology studies disease mechanisms.
Public Health Pearl: Epidemiology asks the questions; biostatistics helps answer them quantitatively.
Research Insight: Modern epidemiologic research relies heavily on advanced statistical modeling techniques.
,Question 9
Which of the following best represents a quantitative variable?
A. Blood type
B. Marital status
C. Annual household income
D. Smoking status
Correct Answer: C
Rationale: Annual household income is a quantitative variable because it is measured numerically and allows
meaningful arithmetic operations. Quantitative variables may be discrete or continuous and are commonly
analyzed using descriptive and inferential statistical methods. Numerical variables provide rich information and
support a wide range of analyses, including means, standard deviations, correlations, and regression models.
Public health researchers frequently use income data to evaluate socioeconomic influences on health outcomes
and healthcare access.
Why Not A: Blood type is a nominal categorical variable.
Why Not B: Marital status is categorical.
Why Not D: Smoking status is categorical.
Public Health Pearl: Quantitative variables often permit more powerful statistical analyses than categorical
variables.
Research Insight: Income is commonly used as a predictor variable in health disparities research.
Question 10
A public health investigator calculates the proportion of survey participants who report receiving an
influenza vaccine during the previous year. This measure is an example of:
A. A population parameter
B. A sample statistic
C. A sampling frame
D. A study protocol
Correct Answer: B
Rationale: Because the proportion is calculated from survey participants rather than the entire target
population, it represents a sample statistic. Statistics summarize characteristics observed within samples and
are used to estimate corresponding population parameters. Sample proportions are among the most frequently
reported measures in public health because they provide estimates of prevalence, coverage, and behavioral
patterns. Statistical inference allows researchers to determine how closely sample estimates may reflect the
true values in the broader population.
,Why Not A: Population parameters describe the entire population.
Why Not C: A sampling frame is a list from which participants are selected.
Why Not D: A study protocol outlines research procedures.
Public Health Pearl: Sample proportions are essential tools for monitoring public health indicators.
Research Insight: Vaccination coverage estimates are routinely generated using sample survey data.
Question 11
A public health researcher wishes to estimate the average body mass index (BMI) among adults living in a
metropolitan area. Which quantity represents the population parameter of interest?
A. The mean BMI calculated from the study sample
B. The average BMI of all adults living in the metropolitan area
C. The largest BMI observed in the sample
D. The average BMI among study participants who completed follow-up
Correct Answer: B
Rationale: A population parameter is a numerical characteristic describing an entire population. In this
scenario, the investigator is interested in the average BMI of every adult residing within the metropolitan area.
Because collecting BMI data from every resident would be difficult and expensive, researchers typically collect
information from a sample and calculate a sample statistic. The sample mean serves as an estimate of the
unknown population mean. Distinguishing between parameters and statistics is one of the most fundamental
concepts in biostatistics because inferential procedures are specifically designed to use sample data to estimate
population characteristics while accounting for uncertainty due to sampling variability.
Why Not A: This represents a sample statistic rather than a population parameter.
Why Not C: The maximum BMI does not represent the average BMI.
Why Not D: This includes only a subset of participants and does not describe the entire population.
Public Health Pearl: Population parameters are usually unknown and must be estimated using sample
statistics.
Research Insight: Most public health surveillance systems are designed to estimate population parameters
from representative samples.
Question 12
A county health department reports that 18% of surveyed adults currently use tobacco products. The
reported percentage is best described as:
A. A population parameter
B. A sample statistic
, C. A measurement error
D. A study bias
Correct Answer: B
Rationale: The 18% figure is calculated from surveyed individuals rather than every adult in the county.
Therefore, it is a sample statistic. Statistics summarize sample data and provide estimates of population
characteristics. Researchers use sample statistics because collecting information from every individual is rarely
feasible. The accuracy of a sample statistic depends on sample size, sampling methodology, and
representativeness. Statistical inference allows investigators to evaluate how closely a sample statistic is likely
to approximate the true population parameter.
Why Not A: A parameter describes the entire population.
Why Not C: No evidence suggests measurement error occurred.
Why Not D: A statistic itself is not bias.
Public Health Pearl: Prevalence estimates reported in public health surveys are often sample statistics.
Research Insight: Tobacco surveillance programs routinely use sample statistics to monitor trends over time.
Question 13
A researcher records the number of emergency department visits experienced by each participant during
the previous year. This variable is most appropriately classified as:
A. Continuous quantitative
B. Discrete quantitative
C. Nominal
D. Ordinal
Correct Answer: B
Rationale: The number of emergency department visits is a discrete quantitative variable because it consists of
countable whole numbers. Participants may have 0, 1, 2, 3, or more visits, but fractional visits are generally not
possible. Discrete variables arise frequently in public health research when measuring events such as hospital
admissions, disease cases, births, deaths, or healthcare encounters. Although discrete variables are numerical,
they differ from continuous variables because their possible values are countable rather than infinitely divisible.
Why Not A: Continuous variables can assume any value within a range.
Why Not C: The variable is numerical rather than categorical.
Why Not D: The values are counts rather than ranked categories.
Public Health Pearl: Counts of health events are commonly analyzed using specialized statistical methods.
Research Insight: Healthcare utilization studies frequently analyze counts of visits, admissions, and procedures.
COMPLETE EXAM BANK | 800 PRACTICE QUESTIONS & DETAILED RATIONALES | ALL 13 CHAPTERS | UPDATED
2026–2027
Premium Table of Contents
,Essentials of Biostatistics in Public Health, 4th Edition by Lisa M. Sullivan
Complete Exam Bank | 800 Practice Questions & Detailed Rationales | Updated 2026–2027
Chapter Question Range Chapter Title
Chapter 1 1–60 Introduction to Biostatistics and Public Health Research
Chapter 2 61–120 Study Designs in Public Health Research
Chapter 3 121–180 Quantifying the Extent of Disease and Measures of Health
Chapter 4 181–240 Summarizing and Presenting Data Collected in Samples
Chapter 5 241–300 Probability Concepts and Applications in Public Health
Chapter 6 301–360 Confidence Interval Estimation and Statistical Inference
Chapter 7 361–430 Hypothesis Testing Procedures and Interpretation
Chapter 8 431–490 Power Analysis and Sample Size Determination
Chapter 9 491–560 Comparing Two Groups and Statistical Comparisons
Chapter 10 561–620 Analysis of Variance (ANOVA) and Related Methods
Chapter 11 621–690 Correlation, Linear Regression, and Multivariable Analysis
Chapter 12 691–760 Logistic Regression and Advanced Modeling Techniques
Chapter 13 761–800 Survival Analysis, Data Visualization, and Special Topics in Biostatistics
Total Questions: 800
Format Includes: Multiple-choice questions, correct answers, detailed rationales, why-not explanations,
public health pearls, research insights, calculation-based items, interpretation scenarios, and graduate-level
MPH/CEPH review coverage.
Essentials of Biostatistics in Public Health, 4th Edition by Lisa M. Sullivan:Chapter 1: Introduction to
Biostatistics and Public Health Research
Question 1
A state public health agency plans to estimate the prevalence of hypertension among adults aged 18 years
and older. Investigators randomly select 3,000 adults from across the state and collect blood pressure
measurements. Which statement best identifies the population of interest?
A. The 3,000 adults selected for the survey
,B. Adults who were found to have hypertension
C. All adults aged 18 years and older residing in the state
D. Adults who completed every survey question
Correct Answer: C
Rationale: The population of interest is the entire group about which researchers want to draw conclusions. In
this study, the investigators seek to estimate hypertension prevalence among all adults aged 18 years and older
living in the state. The 3,000 individuals selected for participation constitute a sample drawn from that larger
population. Biostatistical methods are used to analyze sample data and estimate population parameters while
accounting for sampling variability. A clearly defined target population is essential because it determines the
scope of inference and influences study design, sampling strategies, and interpretation of findings. If the
sample is representative, investigators can generalize their results to the broader adult population of the state.
Why Not A: The 3,000 participants represent the sample rather than the population.
Why Not B: This group includes only participants with hypertension and does not represent all adults.
Why Not D: Individuals completing every survey question represent only a subset of participants.
Public Health Pearl: Population parameters are generally unknown and must be estimated from sample
statistics.
Research Insight: National surveys such as population health surveillance systems rely on representative
sampling to estimate disease prevalence.
Question 2
An investigator records participant sex as male, female, or another self-identified category. What type of
variable is being measured?
A. Continuous
B. Nominal
C. Ordinal
D. Ratio
Correct Answer: B
Rationale: This variable is nominal because it consists of categories that identify group membership without
implying a natural order or ranking. Nominal variables are common in public health research and are typically
summarized using frequencies, percentages, and contingency tables. Understanding variable types is critical
because statistical procedures depend on the scale of measurement. For example, means and standard
deviations are not appropriate summaries for nominal data. Instead, categorical analyses such as chi-square
tests are often used. Correctly classifying variables is one of the first steps in statistical analysis and helps
ensure valid conclusions.
Why Not A: Continuous variables can take infinitely many numerical values.
,Why Not C: Ordinal variables have categories with a meaningful order.
Why Not D: Ratio variables are numerical and possess a true zero point.
Public Health Pearl: Proper variable classification guides appropriate data analysis and interpretation.
Research Insight: Demographic variables are routinely collected in epidemiologic studies to describe study
populations and evaluate disparities.
Question 3
A researcher measures body mass index (BMI) for each participant in a community health study. BMI is best
classified as which type of variable?
A. Nominal
B. Binary
C. Continuous quantitative
D. Ordinal
Correct Answer: C
Rationale: Body mass index is a quantitative continuous variable because it can assume a wide range of
numerical values with meaningful decimal precision. Continuous variables provide more detailed information
than categorical variables and often increase statistical power. In public health research, BMI is frequently
analyzed as a continuous outcome to evaluate obesity trends, associations with disease risk, and effectiveness
of interventions. Because continuous variables contain substantial information, researchers often prefer
analyzing them in their original form unless categorization is clinically justified.
Why Not A: BMI is not a category-based variable.
Why Not B: BMI is not limited to two possible outcomes.
Why Not D: BMI values are measured numerically rather than ranked categories.
Public Health Pearl: Continuous variables often provide greater analytical flexibility than categorized variables.
Research Insight: BMI is one of the most commonly used indicators in population health surveillance.
Question 4
A public health researcher reports that the average systolic blood pressure among a sample of 500 adults is
126 mmHg. This value is an example of a:
A. Population parameter
B. Statistic
C. Sampling frame
D. Census measure
,Correct Answer: B
Rationale: A statistic is a numerical summary calculated from a sample. Because the mean blood pressure was
computed using data from 500 sampled adults rather than every adult in the population, the value represents a
statistic. Statistics are used to estimate unknown population parameters and form the foundation of inferential
biostatistics. Researchers rely on statistics to make evidence-based conclusions while recognizing that sample
estimates are subject to sampling variability.
Why Not A: Parameters describe entire populations.
Why Not C: A sampling frame is a list used to identify potential participants.
Why Not D: A census includes every member of a population.
Public Health Pearl: Sample statistics are the building blocks of statistical inference.
Research Insight: Many public health decisions are based on estimates derived from sample statistics rather
than complete population data.
Question 5
Which of the following best describes the primary purpose of biostatistics in public health research?
A. Eliminate all uncertainty from research findings
B. Replace epidemiologic investigation
C. Provide methods for collecting, analyzing, and interpreting health data
D. Guarantee that every study reaches statistically significant results
Correct Answer: C
Rationale: Biostatistics provides the scientific framework for transforming health data into meaningful
information that can support decision-making. It encompasses study design, data collection, data
management, statistical analysis, and interpretation of results. While biostatistics helps quantify uncertainty
and improve decision-making, it cannot eliminate uncertainty entirely. Statistical methods allow researchers to
evaluate evidence objectively and determine whether observed patterns likely reflect true population
phenomena or random variation. As a result, biostatistics is a cornerstone of evidence-based public health
practice.
Why Not A: Uncertainty can be reduced but never completely eliminated.
Why Not B: Biostatistics complements epidemiology rather than replacing it.
Why Not D: Statistical significance cannot be guaranteed.
Public Health Pearl: Biostatistics converts data into evidence that informs public health action.
Research Insight: Every major public health intervention relies on statistical evidence generated through
biostatistical methods.
,Question 6
A national health survey aims to estimate the prevalence of diabetes among adults in a country.
Investigators select 10,000 participants using a scientifically designed sampling strategy. Why is sampling
used instead of studying every adult in the country?
A. Sampling completely eliminates bias
B. Sampling is generally more feasible, less costly, and less time-consuming while still providing valid estimates
C. Sampling guarantees perfect accuracy
D. Sampling removes the need for statistical analysis
Correct Answer: B
Rationale: In most public health investigations, studying every individual in a population is impractical because
of financial, logistical, and time constraints. Sampling allows researchers to collect information from a
representative subset of the population and use statistical methods to estimate population characteristics.
When sampling is performed properly, valid and reliable conclusions can be drawn about the target population.
Although sampling introduces sampling variability, it remains the foundation of most epidemiologic and public
health research. Carefully selected samples often provide highly accurate estimates while requiring
substantially fewer resources than a complete census.
Why Not A: Sampling can reduce bias when properly designed but cannot completely eliminate it.
Why Not C: All estimates contain some uncertainty.
Why Not D: Statistical analysis remains essential when using sampled data.
Public Health Pearl: Most public health evidence originates from representative samples rather than entire
populations.
Research Insight: National surveys such as health and nutrition surveillance programs rely on complex
sampling designs to generate population estimates.
Question 7
A researcher records participants' educational attainment as elementary school, high school, bachelor's
degree, master's degree, or doctoral degree. This variable is best classified as:
A. Continuous
B. Nominal
C. Ordinal
D. Binary
Correct Answer: C
,Rationale: Educational attainment represents an ordinal variable because the categories possess a natural
ranking from lower to higher levels of education. However, the differences between categories are not
necessarily equal or measurable in a numerical sense. Ordinal variables occupy an important middle ground
between nominal and quantitative variables. Researchers frequently summarize ordinal variables using
frequencies, percentages, medians, or nonparametric statistical methods. Recognizing the ordinal nature of
educational attainment ensures that appropriate analytical techniques are selected and prevents misuse of
statistical procedures designed for continuous variables.
Why Not A: Educational attainment is not measured on a continuous numerical scale.
Why Not B: The categories possess a meaningful order.
Why Not D: There are more than two possible categories.
Public Health Pearl: Ordinal variables contain ranking information but not equal numerical spacing.
Research Insight: Educational attainment is frequently analyzed as a social determinant of health.
Question 8
An epidemiologist is interested in determining whether smoking is associated with lung cancer. Which
discipline primarily provides the methods for analyzing the resulting data and quantifying the strength of
evidence?
A. Anatomy
B. Biostatistics
C. Physiology
D. Pathology
Correct Answer: B
Rationale: Biostatistics provides the mathematical and analytical framework necessary for evaluating
associations between exposures and outcomes. Once data are collected, statistical methods help determine
whether observed relationships are likely due to chance or reflect true underlying associations. Biostatistics also
provides estimates of effect size, confidence intervals, measures of uncertainty, and hypothesis-testing
procedures. In public health research, biostatistics and epidemiology work together closely: epidemiology
focuses on study design and disease patterns, while biostatistics provides tools for analyzing and interpreting
findings.
Why Not A: Anatomy focuses on body structure.
Why Not C: Physiology examines body function.
Why Not D: Pathology studies disease mechanisms.
Public Health Pearl: Epidemiology asks the questions; biostatistics helps answer them quantitatively.
Research Insight: Modern epidemiologic research relies heavily on advanced statistical modeling techniques.
,Question 9
Which of the following best represents a quantitative variable?
A. Blood type
B. Marital status
C. Annual household income
D. Smoking status
Correct Answer: C
Rationale: Annual household income is a quantitative variable because it is measured numerically and allows
meaningful arithmetic operations. Quantitative variables may be discrete or continuous and are commonly
analyzed using descriptive and inferential statistical methods. Numerical variables provide rich information and
support a wide range of analyses, including means, standard deviations, correlations, and regression models.
Public health researchers frequently use income data to evaluate socioeconomic influences on health outcomes
and healthcare access.
Why Not A: Blood type is a nominal categorical variable.
Why Not B: Marital status is categorical.
Why Not D: Smoking status is categorical.
Public Health Pearl: Quantitative variables often permit more powerful statistical analyses than categorical
variables.
Research Insight: Income is commonly used as a predictor variable in health disparities research.
Question 10
A public health investigator calculates the proportion of survey participants who report receiving an
influenza vaccine during the previous year. This measure is an example of:
A. A population parameter
B. A sample statistic
C. A sampling frame
D. A study protocol
Correct Answer: B
Rationale: Because the proportion is calculated from survey participants rather than the entire target
population, it represents a sample statistic. Statistics summarize characteristics observed within samples and
are used to estimate corresponding population parameters. Sample proportions are among the most frequently
reported measures in public health because they provide estimates of prevalence, coverage, and behavioral
patterns. Statistical inference allows researchers to determine how closely sample estimates may reflect the
true values in the broader population.
,Why Not A: Population parameters describe the entire population.
Why Not C: A sampling frame is a list from which participants are selected.
Why Not D: A study protocol outlines research procedures.
Public Health Pearl: Sample proportions are essential tools for monitoring public health indicators.
Research Insight: Vaccination coverage estimates are routinely generated using sample survey data.
Question 11
A public health researcher wishes to estimate the average body mass index (BMI) among adults living in a
metropolitan area. Which quantity represents the population parameter of interest?
A. The mean BMI calculated from the study sample
B. The average BMI of all adults living in the metropolitan area
C. The largest BMI observed in the sample
D. The average BMI among study participants who completed follow-up
Correct Answer: B
Rationale: A population parameter is a numerical characteristic describing an entire population. In this
scenario, the investigator is interested in the average BMI of every adult residing within the metropolitan area.
Because collecting BMI data from every resident would be difficult and expensive, researchers typically collect
information from a sample and calculate a sample statistic. The sample mean serves as an estimate of the
unknown population mean. Distinguishing between parameters and statistics is one of the most fundamental
concepts in biostatistics because inferential procedures are specifically designed to use sample data to estimate
population characteristics while accounting for uncertainty due to sampling variability.
Why Not A: This represents a sample statistic rather than a population parameter.
Why Not C: The maximum BMI does not represent the average BMI.
Why Not D: This includes only a subset of participants and does not describe the entire population.
Public Health Pearl: Population parameters are usually unknown and must be estimated using sample
statistics.
Research Insight: Most public health surveillance systems are designed to estimate population parameters
from representative samples.
Question 12
A county health department reports that 18% of surveyed adults currently use tobacco products. The
reported percentage is best described as:
A. A population parameter
B. A sample statistic
, C. A measurement error
D. A study bias
Correct Answer: B
Rationale: The 18% figure is calculated from surveyed individuals rather than every adult in the county.
Therefore, it is a sample statistic. Statistics summarize sample data and provide estimates of population
characteristics. Researchers use sample statistics because collecting information from every individual is rarely
feasible. The accuracy of a sample statistic depends on sample size, sampling methodology, and
representativeness. Statistical inference allows investigators to evaluate how closely a sample statistic is likely
to approximate the true population parameter.
Why Not A: A parameter describes the entire population.
Why Not C: No evidence suggests measurement error occurred.
Why Not D: A statistic itself is not bias.
Public Health Pearl: Prevalence estimates reported in public health surveys are often sample statistics.
Research Insight: Tobacco surveillance programs routinely use sample statistics to monitor trends over time.
Question 13
A researcher records the number of emergency department visits experienced by each participant during
the previous year. This variable is most appropriately classified as:
A. Continuous quantitative
B. Discrete quantitative
C. Nominal
D. Ordinal
Correct Answer: B
Rationale: The number of emergency department visits is a discrete quantitative variable because it consists of
countable whole numbers. Participants may have 0, 1, 2, 3, or more visits, but fractional visits are generally not
possible. Discrete variables arise frequently in public health research when measuring events such as hospital
admissions, disease cases, births, deaths, or healthcare encounters. Although discrete variables are numerical,
they differ from continuous variables because their possible values are countable rather than infinitely divisible.
Why Not A: Continuous variables can assume any value within a range.
Why Not C: The variable is numerical rather than categorical.
Why Not D: The values are counts rather than ranked categories.
Public Health Pearl: Counts of health events are commonly analyzed using specialized statistical methods.
Research Insight: Healthcare utilization studies frequently analyze counts of visits, admissions, and procedures.